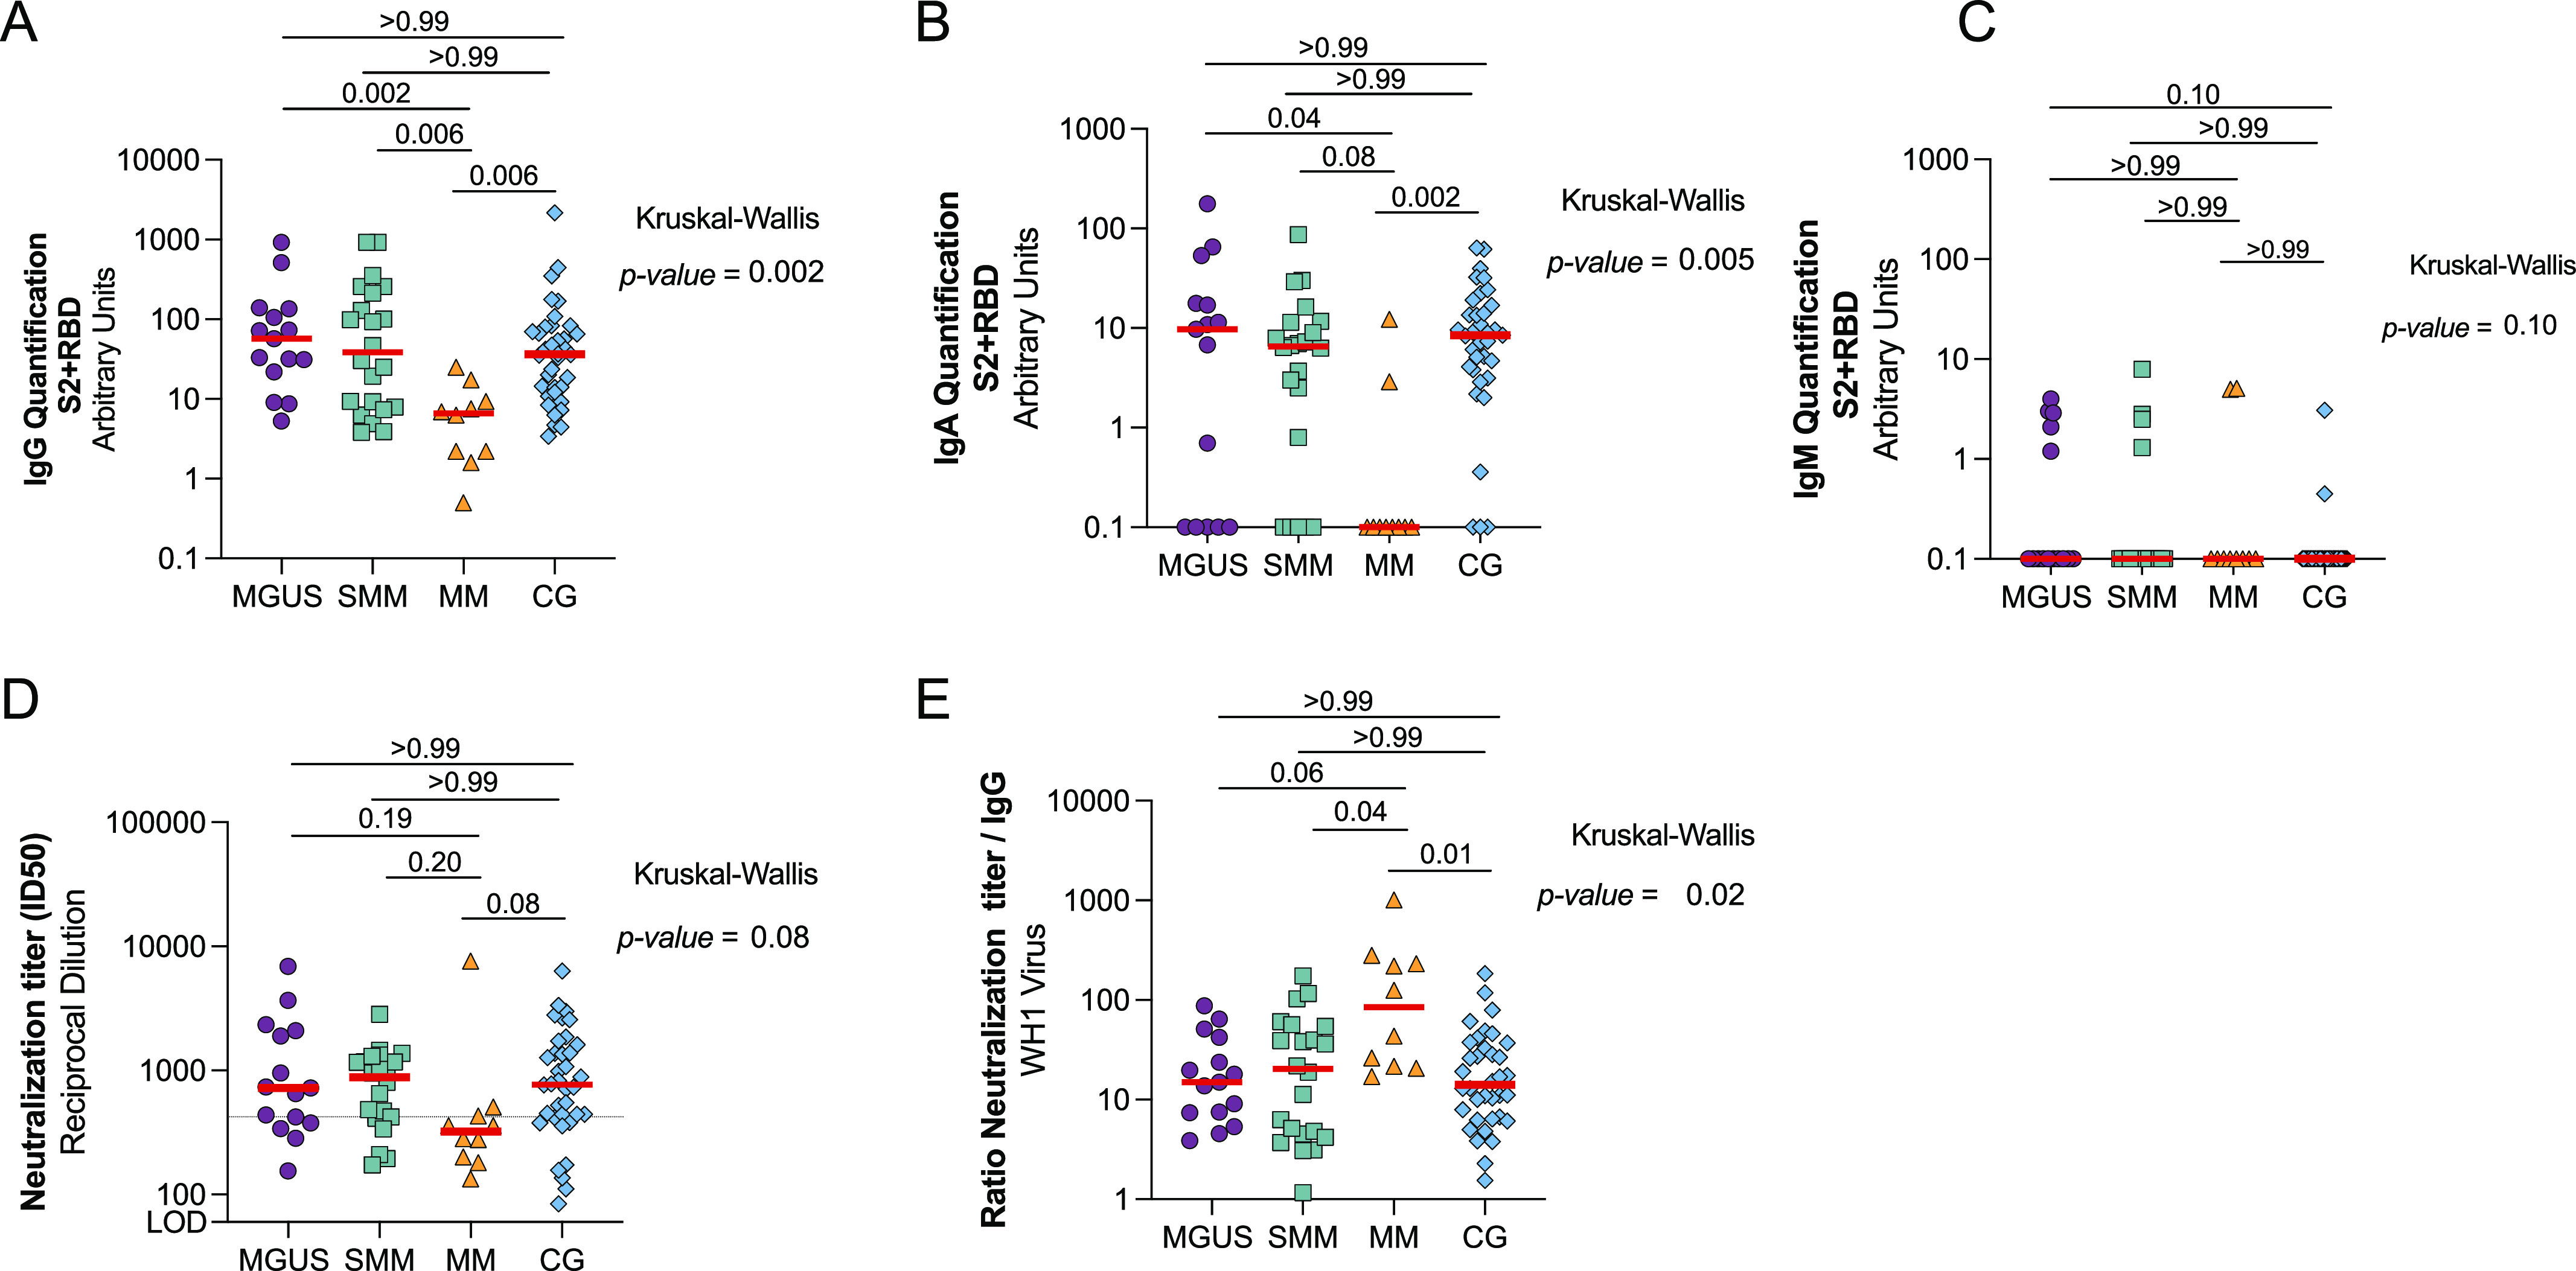
Figure 2. Comparison of humoral response after 3 mo from mRNA vaccination in uninfected patients with monoclonal gammopathies compared with a control group (CG).
(A, B, C, D) Levels of specific SARS-CoV-2 immunoglobulins IgG (Panel A), IgA (Panel B), and IgM (Panel C) against S2+RBD proteins quantified and neutralizing activity against WH1 (Panel D) from MGUS, SMM, and MM patients and a control group (CG) after 3 mo of vaccine administration. (D) Dotted line indicates the 25th percentile of neutralization titer from CG (Panel D). Panel (E) Ratio of plasma neutralization titer per total SARS-CoV-2 IgG antibodies. Median values are indicated; P-values were obtained from Kruskal–Wallis test for comparison between groups and the post hoc Dunn’s multiple comparison’s test. Only significant P-values are shown. Each symbol represents a participant, and are color-coding according to their disease group (MGUS, purple square; SMM, upper triangle turquoise; MM, lower triangle orange, and CG, blue diamond).
Source data are available for this figure.

