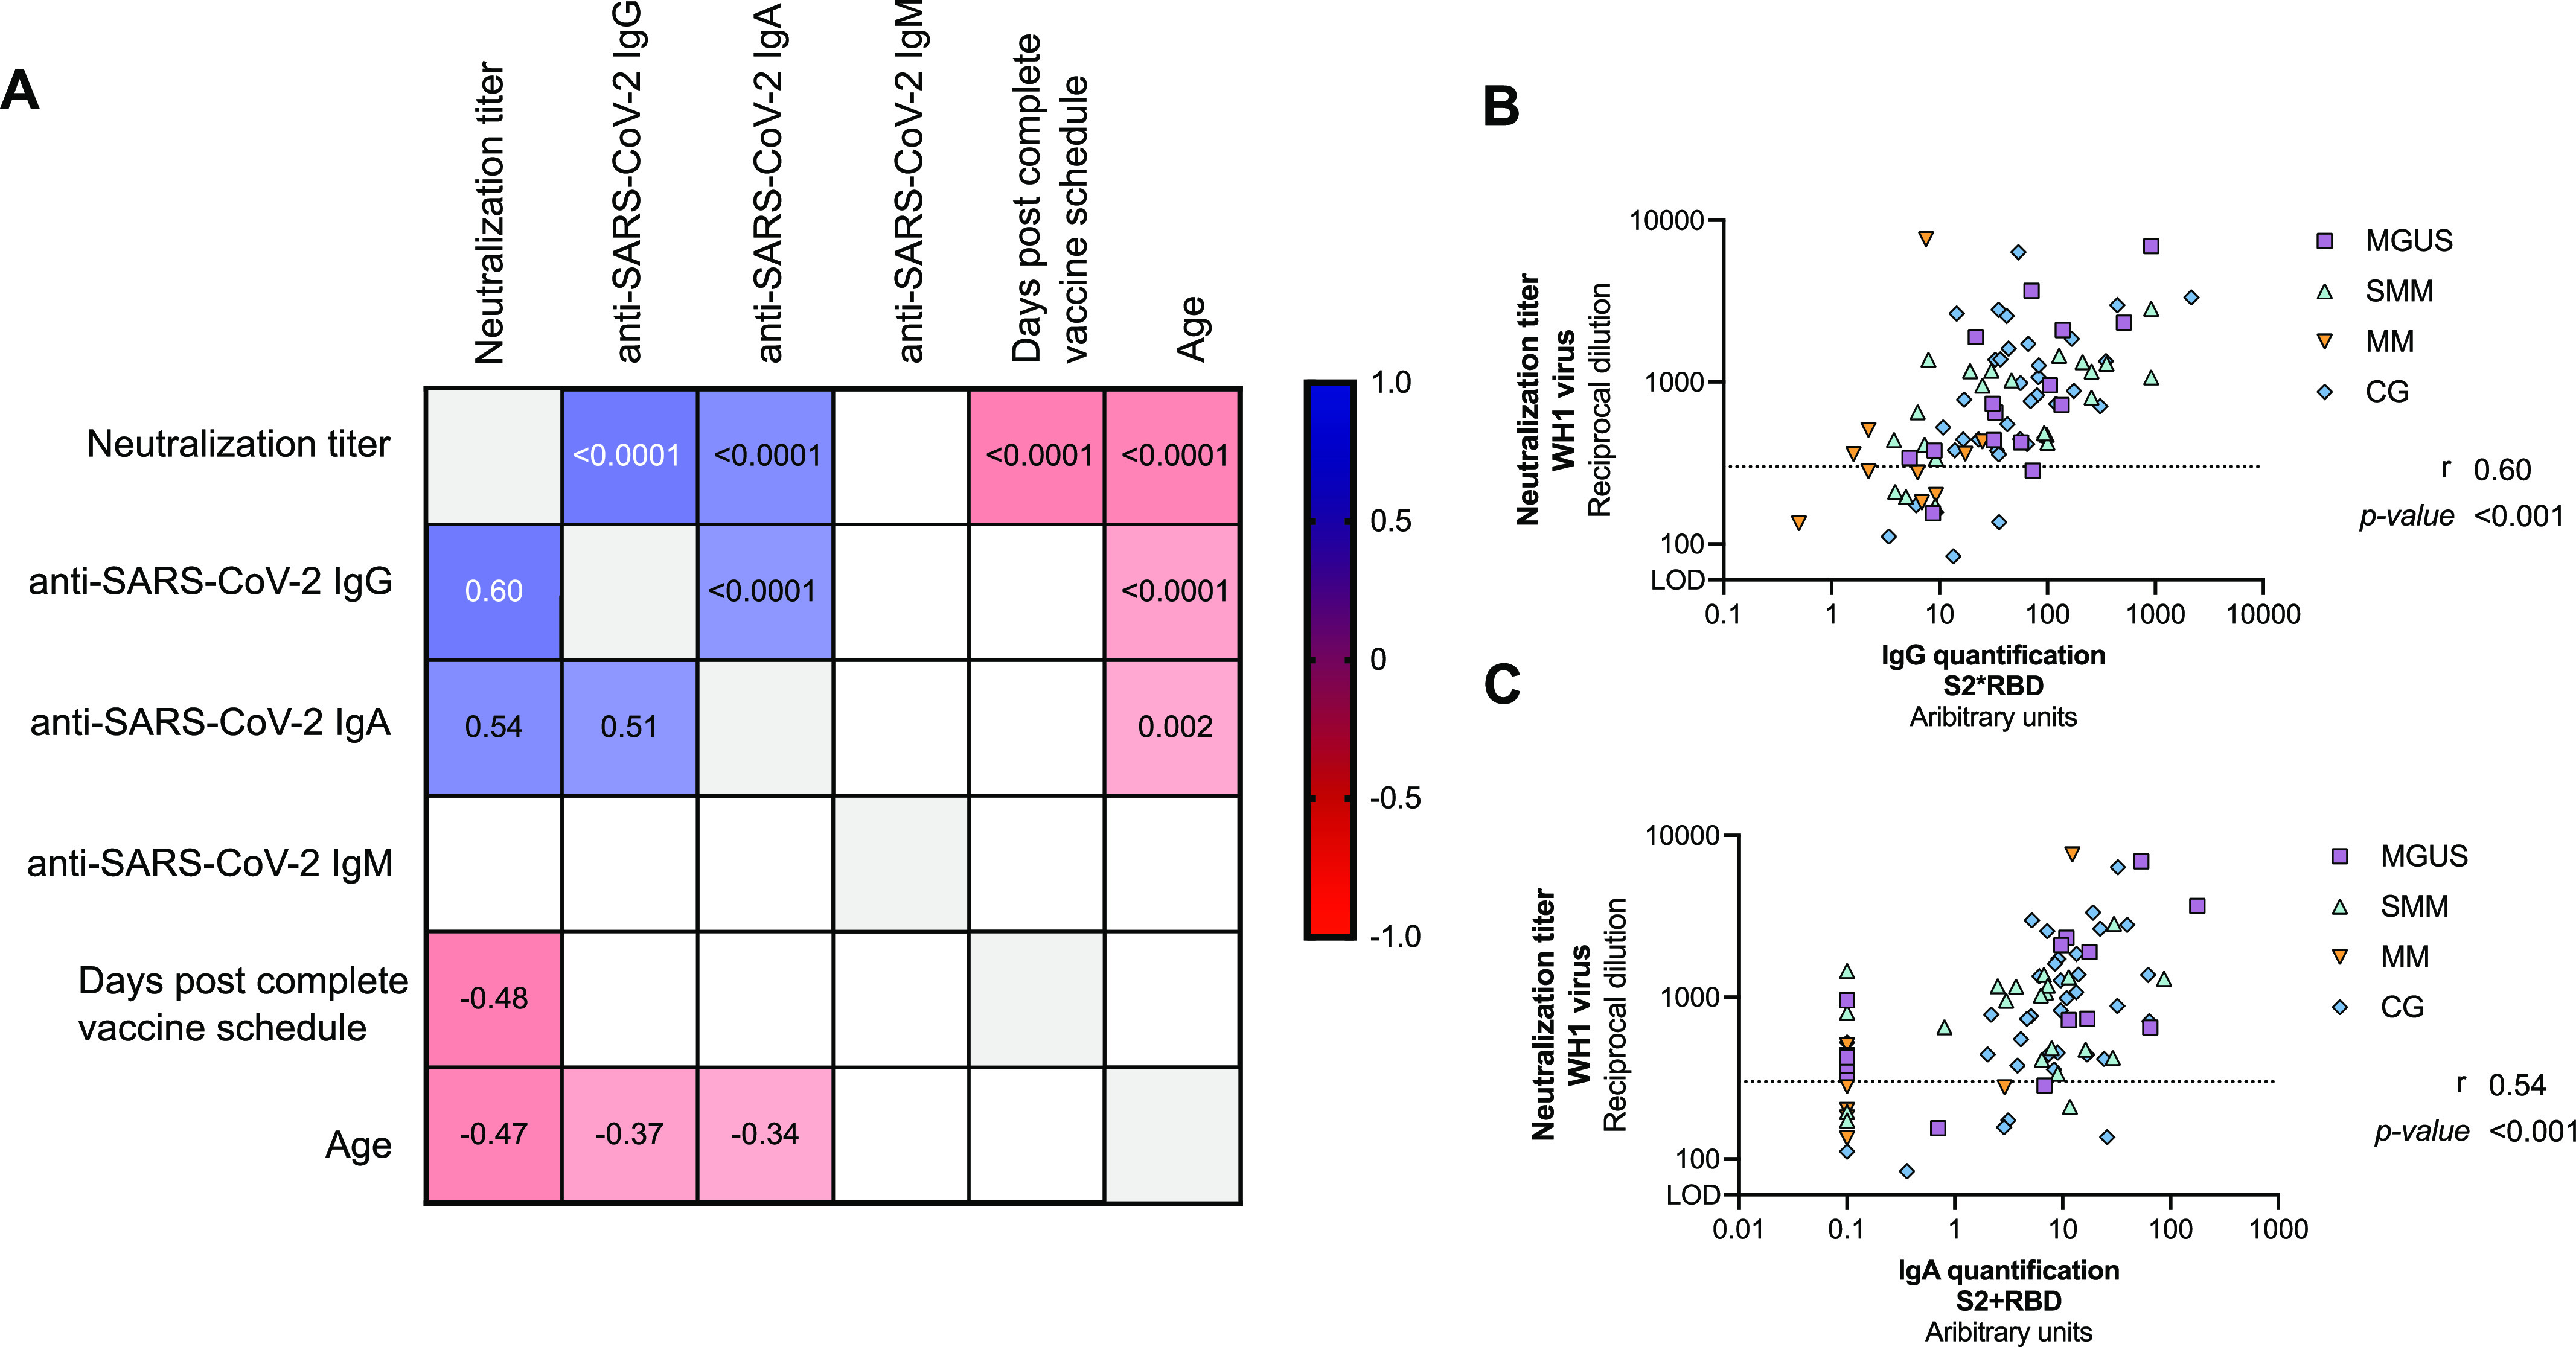
Figure 3. Correlations between variables.

Panel (A) Correlation matrix of relevant continuous variables including MGUS, SMM, MM, and CG participants. Spearman coefficients are indicated in the lower part of the panel, whereas P-values in the upper part. Only significant correlations are plotted (P < 0.05). Positive correlations are shown in blue, whereas negative in red. (B, C) Detail of the correlation between the levels of SARS-CoV-2–specific IgG (Panel B) and IgA (Panel C) antibodies and neutralization capacity. Each symbol represents a participant, and are color-coding according to their disease group (MGUS, purple square; SMM, upper triangle turquoise; MM, lower triangle orange, and CG, blue diamond). Correlation coefficient and P-values were obtained from Spearman correlation.
