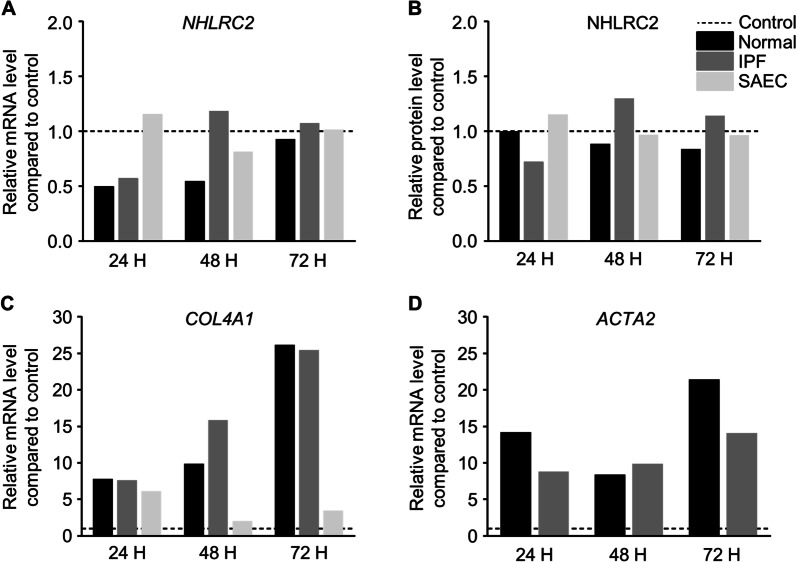
Fig. 6.
The effect of transforming growth factor (TGF)-β1 on NHLRC2 expression. Primary stromal cells derived from normal control lung (n = 1) and idiopathic pulmonary fibrosis (IPF) (n = 1), and small airway epithelial cell line (SAEC, n = 1) were exposed to 5 ng/ml TGF-β1 for 24 to 72 h. Total RNA was isolated and cellular lysates were prepared. A NHLRC2 levels were measured by reverse transcriptase polymerase chain reaction (RT-qPCR), normalized to GAPDH, and represented graphically as the fold change compared to non-treated cells (control). B NHLRC2 band intensities were quantified from immunoblots (shown in Additional file 2: Figure S1B) using Image Studio Lite software, normalized to GAPDH, and compared to non-treated cells. C, D COL4A1 and ACTA2 levels were measured by RT-qPCR, normalized to GAPDH, and represented graphically as the fold change compared to non-treated cells (control) to confirm the fibroblast to myofibroblast activation by TGF-β1

