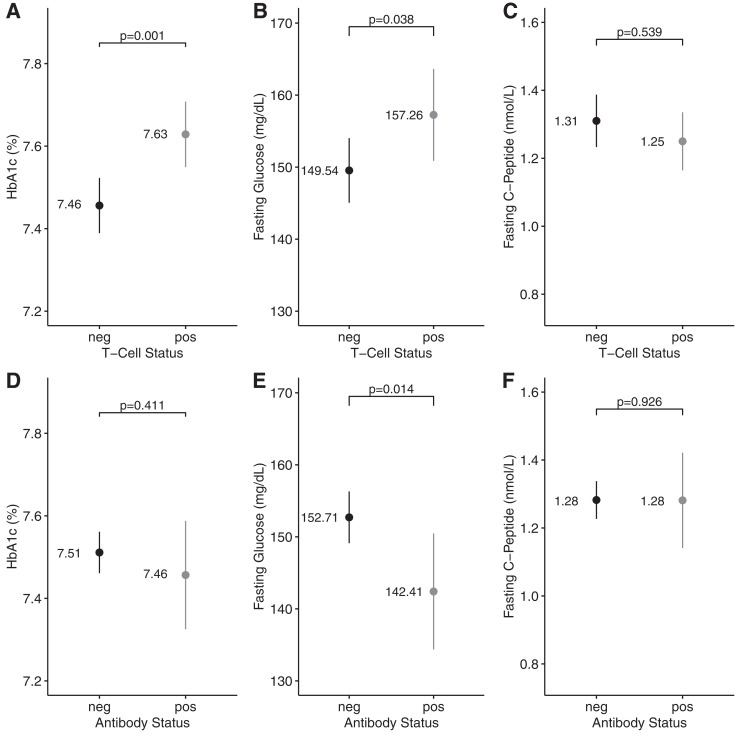
Figure 1.
Comparison of glycemic parameters and fasting C-peptide in T+/T− and Ab+/Ab− patients. Unadjusted means and 95% CIs for HbA1c, fasting glucose, and fasting C-peptide levels in T− (n = 133) compared with T+ (n = 189) participants (A–C) and Ab+ (n = 53) compared with Ab− (n = 339) participants with T2D (D–F). A and D show group comparisons for HbA1c; B and E show comparisons for fasting glucose; and C and F show comparisons for fasting C-peptide. neg, negative; pos, positive.

