
Figure 3. Calibration plots of observed 5‐year atrial fibrillation (AF) risk vs predicted 5‐year AF risk with patients divided into risk groups based on deciles in the development cohort.
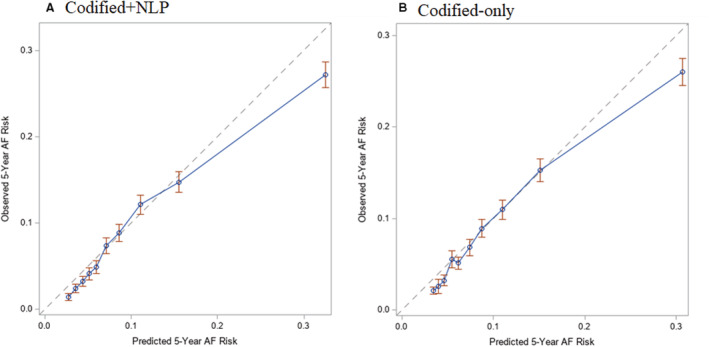
A, Depicts the plot of observed 5‐year AF risk (y axis) vs predicted 5‐year AF risk (x axis) for the codified+natural language processing (NLP) model in blue, whereas the optimal calibration is shown in gray. B, Depicts the plot of observed 5‐year AF risk (y axis) vs predicted 5‐year AF risk (x axis) for the codified‐only model in blue, whereas the optimal calibration is shown in gray.