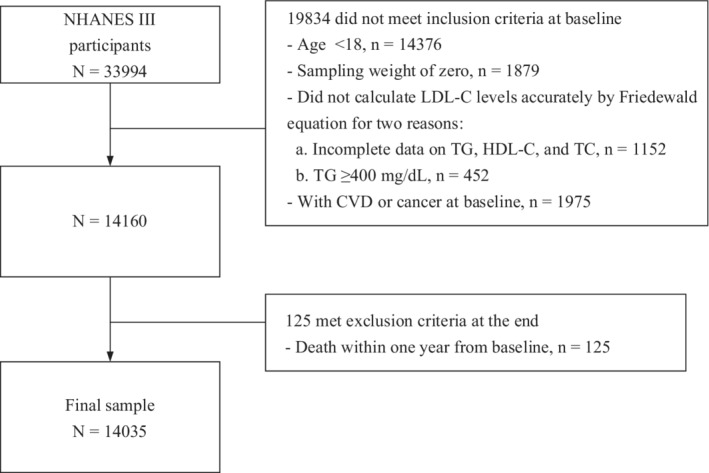
Figure 1. Flow chart of participants in this study.

HDL‐C indicates high‐density lipoprotein cholesterol; LDL‐C, low‐density lipoprotein cholesterol; NHANES III, National Health and Nutrition Examination Survey III; TC, total cholesterol; and TG, triglyceride.
