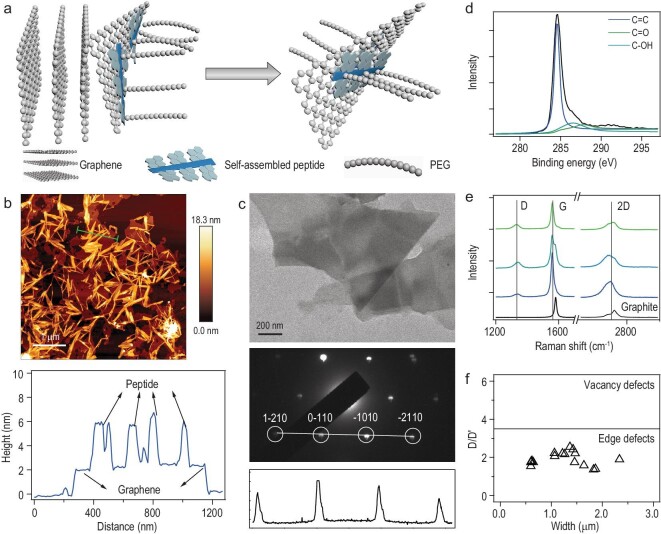
Figure 2.
Characterization of PCG prepared via aqueous exfoliation. (a) Scheme of the ultrasound-assisted mechanical exfoliation of graphite in the presence of self-assembling Py-GAGAGY peptides. (b) AFM topographic image (top) and height profile (bottom) of the self-assembled peptide fibers on an exfoliated graphene surface. (c) TEM image (top), electron diffraction pattern (middle) and diffracted intensity (bottom) taken along the 1 10 to
10 to  210 axis of the graphene after removing the peptide using dialysis. (d) C 1s XPS spectrum of the graphene. The peak areas of C=C, C−OH and C=O are 9436, 918 and 606 a.u., respectively. The low oxygen content indicates the high quality of the produced graphene. (e) Representative Raman spectroscopy of PCG and graphite (excited at 532 nm). (f) Distributions of D/D’ and width of PCG based on Raman spectroscopy. Low D/D’ ratios indicate that the produced graphene only contains a few edge defects and no vacancy or sp3 defects.

