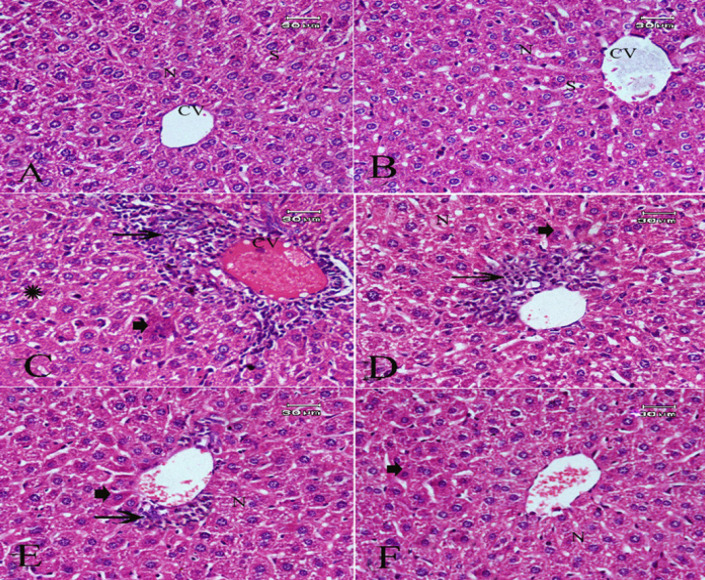
Figure 2.
Photomicrograph of H&E Staining Sections of Liver Showed: (A&B) Normal hepatic tissue architecture and cellular details of negative control group and LAEO treated group respectively. (C) Hepatocellular hydropic degeneration (thick arrow) , necrosis and mononuclear leukocytes infiltrations (thin arrow) with pyknotic nuclei of CP (positive control group). (D&E) Attenuated lesions in groups treated with cyclophosphamide (25mg/kg) and LAEO at the concentrations of 0.4 and 0.6 mg/kg respectively. (F) Greatly ameliorate effect in almost liver cells with few necrotic cells and pyknotic nuclei (thick arrow) in a group of animals treated with cyclophosphamide and LAEO at the highest concentration (0.8 mg/kg)

