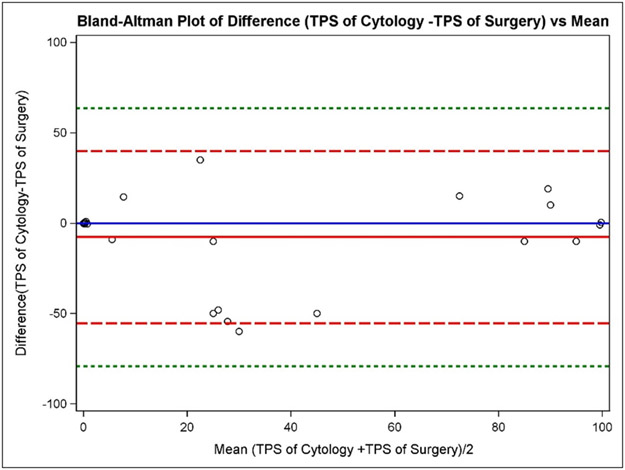
Figure 2: Bland-Altman plot of the difference in the tumor proportion score (TPS) of the cytological versus surgical methods compared to the mean in adenocarcinoma specimens.
Bland-Altman plot used to show the difference between the methods (Cytologic TPS – Surgical TPS) against the average (Cytologic TPS – Surgical TPS)/2 with the addition of a horizontal line at (Cytologic TPS – Surgical TPS) =0 (solid blue line), the mean of the difference (Cytologic TPS – Surgical TPS) (solid red line), dotted lines at ± 2SD (dashed red lines), and dotted lines at ± 3SD (dashed green lines). The mean of the difference (Cytologic TPS – Surgical TPS) is very close to the (Cytologic TPS – Surgical TPS) =0 line, indicating that TPS of cytology measures are, on average, similar to TPS of surgery.

