FIGURE 3.

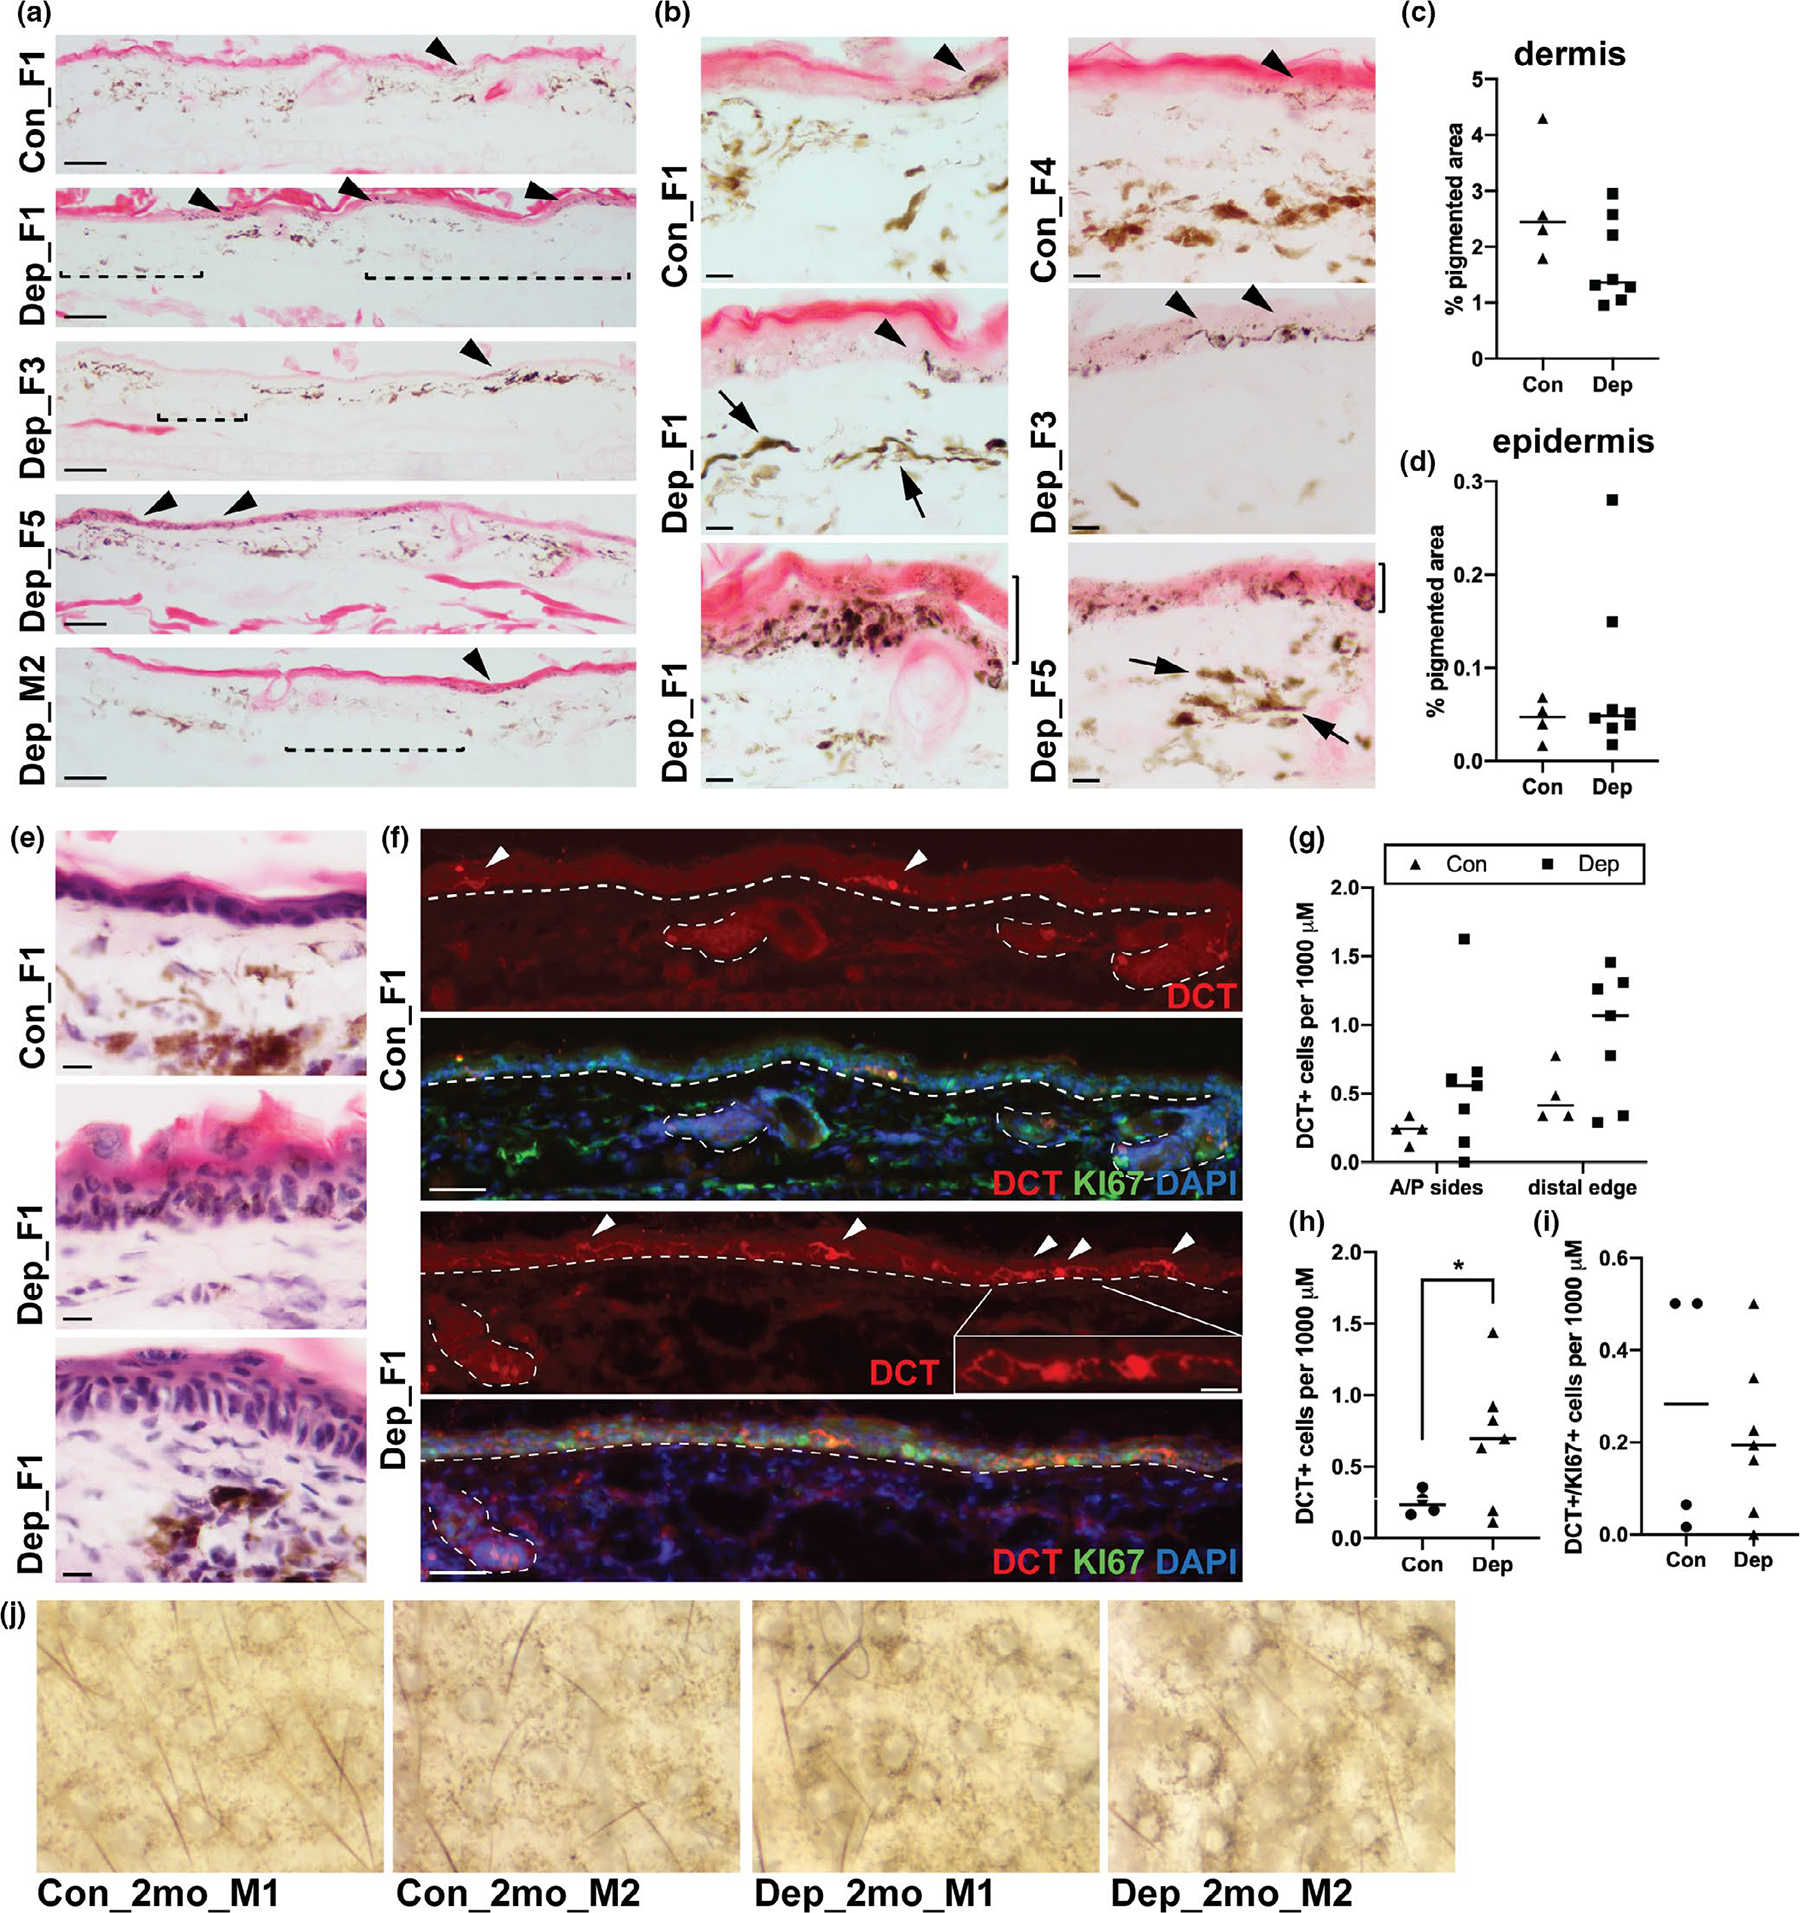
Differential pigment distribution, melanocyte morphology and color, and epidermal melanocyte number in mtDNA-depleter mouse model. (a) Representative images of eosin-stained skin sections taken from the ears of control (Con) and mtDNA-depleter (Dep) female (F) and male (M) mice after 6–8 months on doxycycline diet. Arrowheads indicate regions of epidermal pigment, and dashed brackets indicate regions of dermal hypomelanosis. Scale bar represents 100 mM. (b) Higher magnification images of similar eosin-stained sections as those shown in (a). Arrowheads indicate regions of epidermal pigment; note, highly dendritic cells indicated in Dep_F3. Arrows indicate darkly pigmented and spindle-shaped dermal cells. Solid brackets to the right of lowest panels (Dep_F1 and Dep_F3) indicate regions of basal and suprabasal epidermal pigment. Scale bar represents 10 mM. (c-d) Quantification of the area of pigmented dermis (c) and epidermis (d) observed in unstained skin sections taken from the ears of control and mtDNA-depleter mice described in (a). Each point represents one biological replicate, and the horizontal bar represents the mean of biological replicates for each condition. (e) Representative images of hematoxylin and eosin-stained skin sections taken from the ears of control and mtDNA-depleter mice demonstrating epidermal acanthosis, hyperkeratosis, and parakeratosis in Dep ears. Scale bar represents 10 mM. (f) Representative images of fluorescent immunolabeling of skin sections taken from the ears of control and mtDNA-depleter mice described in (a) and stained for the melanocyte marker DCT (red), proliferation marker KI67 (green), and DNA marker DAPI (blue). Arrowheads indicate epidermal melanocytes. Dashed lines outline the border between the epidermis and dermis and the hair follicles. Scale bar represents 100 mM. Boxed area in Dep_F1 is a higher magnification image of the region indicated, highlighting the dendricity of the epidermal melanocytes in the mtDNA-depleter mice. Scale bar in the high magnification image represents 25 mM. (g) Quantification of the DCT + positive cells observed in the sections described in (f), separated by region of the ear. Each point represents one biological replicate, and the horizontal bar represents the mean of biological replicates for each condition. (h-i) Quantification of the total DCT + cells (h) or DCT+/KI67 + cells (i) observed in the sections described in (f). Each point represents one biological replicate, and the horizontal bar represents the mean of biological replicates for each condition. *p-value < .05, Welch’s t test. Note, for the analyses presented in g-i, one mtDNA-depleter sample was omitted due to inadequate tissue quality for IHC. (j) Whole-mount images of ears of control (Con) and mtDNA-depleter male (M) mice after just 2 months on doxycycline diet
