

Abstract
To improve S-Adenosyl-L-methionine (a compound with important physiological functions, SAM) production, atmospheric and room temperature plasma and ultraviolet-LiCl mutagenesis were carried out with Saccharomyces cerevisiae strain ZY 1–5. The mutants were screened with ethionine, L-methionine, nystatin and cordycepin as screening agents. Adaptive evolution of a positive mutant UV6-69 was further performed by droplet microfluidics cultivation with ethionine as screening pressure. After adaptation, mutant T11-1 was obtained. Its SAM titer in shake flask fermentation reached 1.31 g/L, which was 191% higher than that of strain ZY 1–5. Under optimal conditions, the SAM titer and biomass of mutant T11-1 in 5 L bioreactor reached 10.72 g/L and 105.9 g dcw/L (142.86% and 34.22% higher than those of strain ZY 1–5), respectively. Comparative transcriptome analysis between strain ZY 1–5 and mutant T11-1 revealed the enhancements in TCA cycle and gluconeogenesis/glycolysis pathways as well as the inhibitions in serine and ergosterol synthesis of mutant T11-1. The elevated SAM synthesis of mutant T11-1 may attribute to the above changes. Taken together, this study is helpful for industrial production of SAM.
Keywords: S-Adenosyl-L-methionine, Saccharomyces cerevisiae, Atmospheric and room temperature plasma, Droplet microfluidic
Introduction
Adenosylmethionine (S-Adenosyl-L-methionine, SAM) participates in almost all biological transmethylation, transsulfurization and transaminopropyl reactions (Fontecave et al. 2004). Due to its versatile and important physiological functions, production of SAM has drawn increasing attention (Zhao et al. 2017). Biosynthesis of SAM is catalyzed by methionine adenosyltransferase (MAT, EC 2.5.1.6) with L-methionine and adenosine triphosphate (ATP) as substrates. Currently, production of SAM is mainly performed with microbial fermentation due to the advantages of high-SAM accumulation and no requirement of the expensive ATP (Cao et al. 2012; Chen 2018). With high ATP synthesis ability and MAT activity, Saccharomyces cerevisiae is considered as the main workhorse among the microorganisms (Schlenk et al. 1965; Chan and Appling 2003). However, SAM production with S. cerevisiae still suffers drawbacks such as low conversion of L-methionine (Chen et al. 2016a). To improve SAM production in S. cerevisiae, intensive efforts have been put in strain improvement by mutagenesis (Lin et al. 2004; Cao et al. 2012; Shobayashi et al. 2006; Kanai et al. 2019; Qin et al. 2020), genetic manipulation (Chen et al. 2016b, 2021; Lee et al. 2010; Zhao et al. 2016; Liu et al. 2019; Huang et al. 2012) and process optimization (Lin et al. 2004; Li et al. 2020). Although the SAM titer of S. cerevisiae has been significantly elevated with genetic manipulation in laboratory level, mutagenesis still plays important roles in breeding of SAM-producing S. cerevisiae due to its simple operation, low cost, and potential risks in industrial application of recombinant strain (Cao et al. 2012; Kanai et al. 2019).
In the present research, atmospheric and room temperature plasma mutagenesis (ARTP, a recently developed efficient mutagenesis method for whole-cell of microorganisms, plants and animals) and ultraviolet irradiation were carried out with S. cerevisiae strain ZY 1-5. The mutants were screened with screening agents (ethionine, L-methionine, nystatin and cordycepin) and further adapted with ethionine by droplet microbial microfluidic cultivation. The fermentation process of the resultant mutant was further optimized. Under the optimal conditions, SAM titer of the mutant reached 10.72 g/L. Therefore, mutagenesis and process optimization substantially increased the SAM productivity of S. cerevisiae and the mutant may serve as a promising candidate for SAM production.
Materials and methods
Chemicals and reagents
Adenosylmethionine p-toluene sulfonate disulfate, sodium heptane sulfonate, ethionine, methionine, nystatin, cordycepin, peptone, yeast extract, glucose, biotin, glycerol, calcium pantothenate, vitamin B1, and vitamin B6 were purchased from Shanghai Aladdin Biochemical Technology Co., Ltd. Other analytical grade reagents were purchased from Titan Technology Co., Ltd (Shanghai, China).
Microbial strain and cultivation
Saccharomyces cerevisiae strain ZY 1–5 was provided by Zhejiang Zhenyuan Pharmaceutical Co., Ltd (Shaoxing, China) and maintained at 4 °C on YPD agar slant. For mutagenesis and SAM production, strain ZY 1–5 was incubated in 250 mL shake flask containing 50 mL YPD at 30 °C and 180 rpm.
Mutagenesis by ARTP and UV-LiCl
Mutagenesis by ARTP
Strain ZY 1–5 at logarithmic phase was diluted to approximately 1 × 10⁷ cfu/mL with 0.85% NaCl. Five microliters of 10% sterile glycerol were introduced into 5 μL yeast suspension and mixed thoroughly, then coated evenly on the iron plate. The plates were treated in ARTP-M system (Wuxi Tmaxtree Biotechnology Co., Ltd, China) with 140 W operating power, 2 mm working distance and 10 SLM helium gas flow for different time. Cells on the iron plates were washed down with 1 mL sterile YPD, diluted to appropriate concentration, and coated evenly on YPD agar plates. The lethality rate was calculated after incubation in dark at 30 °C for 48–72 h.
UV-LiCl mutagenesis
Strain ZY 1–5 at logarithmic phase was diluted to approximately 1 × 10⁷ cfu/mL with sterile 0.85% NaCl containing 0.3% LiCl. Two milliliters of yeast suspension were transferred to sterile plate (9 cm in diameter) on a magnetic stirrer, and irradiated at 30 cm directly below two UV lamps (15 W each) for different time. After mutagenesis, the suspension was washed with 6 mL sterile 0.85% NaCl, maintained at 4 °C in dark for 2 h, then diluted to appropriate concentration and coated evenly on YPD agar plate. The lethality rate was calculated after incubation at 30 °C in dark for 48–72 h.
Screening of mutants with screening agents
Ethionine, L-methionine, nystatin and cordycepin were used as screening agents for the mutants. Diluted yeast suspensions from ARTP and UV-LiCl (each treated at suitable time) were separately coated evenly on YPD plates supplemented with ethionine, L-methionine, nystatin and cordycepin. The plates were incubated at 30 °C in dark for 48–72 h.
Adaptive evolution of mutant was performed with ethionine as screening agent using microbial microdroplet culture system MMC I (Wuxi Yuan Qing Tian Mu Biotechnology Co., Ltd, Wuxi, China). The inoculated YPD was transferred to MMC system and cultivated with gradually increased dosage of ethionine at 30 °C. The screening criterium was set as mutant capable of growing quickly under high concentration of screening pressure. During the adaptive evolution, the droplet that exhibited the most improved growth was coated evenly on YPD agar plate. Colonies were chosen and maintained for subsequential experiments.
SAM production in shake flask and 5 L bioreactor
Shake flask fermentation was performed by introducing 2 mL seed culture of strain ZY 1–5 or the mutants into 250 mL shake flask containing 50 mL fermentation medium (glucose 30 g/L, yeast extract 5 g/L, (NH4)2SO4 5 g/L, K2HPO4 5 g/L, 10 g/L KH2PO4, 0.1 g/L MnSO4·7H2O 0.1 g/L, ZnSO4·7H2O 0.1 g/L, MgSO4 0.2 g/L, CaCl2 0.1 g/L, sterilized at 115 °C for 30 min, pH natural) and cultured for 24 h at 30 °C and 180 rpm. Then 2 mL 36 g/L L-methionine was supplemented and cultured for another 24 h. The culture broth was withdrawn for HPLC analysis of SAM.
Five-liter bioreactor fermentation was performed in 5 L BIOTECH 5BG bioreactor (Shanghai Baoxing Biological Equipment Engineering Co., Ltd, Shanghai, China). Seed culture (300 mL) was introduced into 3 L fermentation medium (glucose 30 g/L, yeast extract 5 g/L, (NH4)2SO4 5 g/L, K2HPO4 5 g/L, KH2PO4 10 g/L, MnSO4·7H2O 0.1 g/L, ZnSO4·7H2O 0.6 g/L, MgSO4 1.2 g/L, CaCl2 0.9 g/L, CuSO4 2 mg/L, biotin 0.5 mg/L, calcium pantothenate 4 mg/L, vitamin B1 4 mg/L, and 5 mg/L of vitamin B6. Biotin, calcium pantothenate, vitamin B1, vitamin B6, and other trace elements were sterilized by filtration through sterile 0.22 μm membrane. The remaining components were sterilized at 115 °C for 30 min) and incubated at 30 °C. The pH was adjusted with 14 mol/L NH3·H2O and dissolved oxygen (DO) was controlled by adjusting the aeration and stirring. After 6 h incubation, supplementation of feeding broth (glucose 500 g/L and yeast extract 12 g/L) was initiated. During the fermentation, samples were withdrawn every 4 h. When biomass was stable (about 30 h), 5 g L-methionine was supplemented every 6 h. Glucose concentration was maintained under 5 g/L by adjusting the feeding speed of feeding broth.
Analysis
HPLC analysis of SAM was performed with a 1260 Infinity 2 system equipped with a J&K C18 column (4.6 mm × 250 mm, 5 μm, J&K Scientific Ltd, Beijing, China) as described by Qin et al. (Qin et al. 2020). Biomass was determined as described by Qin et al. (Qin et al. 2020). Glucose concentration was determined with 3,5-dinitrosalicylic acid colorimetric method using UV1600 Spectrophotometer (Aoyi Instrument (Shanghai) Co, Ltd., Shanghai, China).
All experiments were performed in triplicates and the results were presented as the mean ± standard deviation.
Transcriptome analysis
Extraction and transcriptome sequencing of total RNA
Samples were centrifuged at 4 °C, 5000 rpm for 5 min, and precipitation was washed with PBS solution twice, then centrifuged at 4 °C, 8000 rpm for 10 min to collect yeast cells. Total RNA was isolated using TRIzol Reagent (Vazyme Biotech Co., Ltd, Nanjing) following the manufacturer's protocol. Transcriptome sequencing and analyzing were performed by Tsingke Biotechnology Co., Ltd. (Beijing, China).
Differentially expressed gene (DEG) identification
Gene expression was evaluated with FPKM method (Trapnell et al. 2010). EBseq was applied for DEGs’ statistical treatment (Leng et al. 2013), and genes with Fold Change ≥ 2 while FDR < 0.05 were regarded as DEGs.
Results and discussion
ARTP mutagenesis of strain ZY-5 and mutant screening
As a recently developed and useful mutation tool, ARTP has been widely applied in mutation of microorganisms, plants and animals due to advantages such as high efficiency, simple operation, low cost, and environmental friendliness (Zhang et al. 2014; Wang et al. 2020). The proposed mechanisms for ARTP mutagenesis may be ascribed to the direct structural changes of DNA oligonucleotides (Wang et al. 2020) or indirect DNA damage caused by reactive oxygen species/reactive nitrogen species generated by the reaction between plasma and water (Zhang et al. 2014). Qin et al. found that SAM-producing S. cerevisiae ZY, parent strain of ZY 1–5, exhibited higher positive mutation rate under 80 ~ 90% lethality rate when treated with ARTP mutagenesis (Qin et al. 2020). The effect of ARTP-treating time on the lethality rate of strain ZY 1–5 was examined (Fig. 1a). As depicted in Fig. 1a, the lethality rate of strain ZY 1–5 reached around 85% when treated with ARTP for 180 s. Thus, 180 s was set as the suitable mutagenic time for further ARTP mutagenesis. After ARTP mutagenesis (180 s treatment), the resultant yeast suspension was coated evenly on YPD plates containing screening agents. The screening agents included ethionine, nystatin, and cordycepin. Ethionine is an analog of L-methionine which can inhibit the SAM synthetase (EC 2.5.1.6) by competitively binding to the active site of the enzyme with L-methionine. Therefore, S. cerevisiae mutants with high ethionine tolerance may possess improved SAM productivity (Cao et al. 2012). The methylation reaction in ergosterol biosynthesis is one of the main SAM consumptions of S. cerevisiae. With reduced SAM consumption, deficiency in ergosterol biosynthesis will be helpful for the accumulation of SAM in S. cerevisiae. Nystatin had been used as an efficient screening agent for SAM-accumulating mutants with deficiencies in ergosterol biosynthesis (Shobayashi et al. 2006). Cordycepin (3ʹ-deoxyadenosine) is an inhibitor of RNA polymerase and protein kinase such as adenosine kinase of S. cerevisiae. It has been used as a screening agent in screening of high-SAM accumulating mutants with deficient adenosine kinase of S. cerevisiae (Kanai et al. 2019).
Fig. 1.

The lethality curve of strain ZY 1–5 by ARTP a and UV b mutagenesis. The plates were incubated in dark for at 30 °C for 48 h-72 h. Values are presented as mean ± standard deviation for three independent experiments
During the screening, the YPD agar plates containing screening agents were incubated at 30 °C for 48 h. Mutants with large size colony were chosen for SAM productivity analysis by shake flask fermentation. The mutant with the highest SAM titer was domesticated by consecutively streaking on YPD agar plates containing the same concentration screening agents for 3 times and subjected for SAM titer analysis. Then mutant with the highest SAM titer was streaked on fresh YPD agar plates containing elevated concentration of screening agents and further domesticated as described above. The mutagenesis and screening were repeated until there was no significant improvement in SAM titer of the mutant, then the mutant was further treated with ARTP and screened with other screening agents. Mutant 4–11, with SAM titer 0.64 g/L, was obtained from strain ZY 1–5 after screening with 70 mg/L, 100 mg/L, and 130 mg/L ethionine. Mutant 5–41, with SAM titer 0.74 g/L, was obtained from mutant 4–11 after 1 cycle ARTP mutagenesis and screening with 0.8 mg/L, 1.0 mg/L, and 1.2 mg/L nystatin. Mutant 7–17, with SAM titer of 0.87 g/L, was obtained from mutant 5–41 after 1 cycle of ARTP mutagenesis and screening with 30 mg/L, 50 mg/L and 70 mg/L cordycepin.
UV-LiCl mutagenesis of mutant 7–17 and mutant screening
Earlier report indicated that SAM-producing S. sake displayed higher positive mutation rate under lethality rate around 75% when treated with UV-LiCl mutagenesis (Dong et al. 2006). Effect of UV irradiating time on lethality rate of mutant 7–17 was examined (Fig. 1b). As depicted in Fig. 1b, the lethality rate of mutant 7–17 reached around 75% after irradiation for 60 s. Thus, 60 s was set as the suitable mutagenic time for mutagenesis. After irradiation with UV for 60 s, the mutant was screened using L-methionine as screening agents. L-methionine is the precursor of SAM. Excess L-methionine will result in enhancement of L-methionine metabolism such as SAM synthesis in S. cerevisiae. Thus, high concentration of L-methionine as screening pressure is favorable for obtaining mutants with improved SAM synthesis ability (Huang et al. 2012). After treated for 60 s by UV-LiCl mutagenesis and screened with elevated concentration of L-methionine (11 g/L, 13 g/L, and 15 g/L), mutant UV4-11 with SAM titer of 1.13 g/L, was obtained from mutant 7–17.
ARTP-UV compound mutagenesis
ARTP-UV compound mutagenesis was further performed with mutant UV4-11. After treatment of 180 s with ARTP, the resultant yeast suspension was transferred to fresh YPD medium in shake flask and cultured at 30°C and 180 rpm to logarithmic phase. Then the resultant culture was treated for 60 s by UV irradiation. Diluted suspension was coated evenly with YPD agar plates containing 1.5 mg/L nystatin, 50 mg/L cordycepin and 15 g/L L-methionine. The plates were incubated in dark at 30°C and 180 rpm. Large colonies were chosen for SAM titer determination. Mutant UV6-69 exhibited the highest SAM titer (1.23 g/L), which was 173.33% higher than that of strain ZY1-5. ARTP-UV compound mutagenesis is firstly used in the breeding of SAM-producing yeast. Compared to SAM titer of mutant UV4-11 (1.13 g/L), SAM titer of mutant UV 6-69 (1.23 g/L) was only increased by 8.85%. This may be ascribed to the fact that the strain was subject to many runs of mutagenesis, which resulted in the attenuation of mutagenesis effect.
Adaption of mutant UV6-69 by MMC with ethionine as screening pressure
Microbial microdroplet culture system is a novel platform for high-throughput cultivation and adaptive evolution of microbes (Beneyton et al. 2016; Jian et al. 2020; Guo et al. 2021). MMC adaption was carried out with ethionine as screening pressure. Effect of ethionine concentration on growth of mutant UV6-69 in MMC was examined with YPD containing 0, 30 mg/L, 50 mg/L,80 mg/L, 100 mg/L, 130 mg/L, 150 mg/L, 250 mg/L ethionine at 30 °C. Fifty droplets were generated at each ethionine concentration and incubated for 5 cycles. The initial cycle time was 8 h and was increased with the elevated ethionine concentration (Fig. 2a). As depicted in Fig. 2a, mutant UV6-69 exhibited the highest growth in YPD without ethionine while displayed the lowest growth at 0.25 g/L ethionine, which indicated that ethionine can inhibit the growth of mutant UV6-69. Thus, 130 mg/L ethionine was set as initial screening pressure concentration, and was then increased gradually.
Fig. 2.

Growth curves of mutants in MMC. a Growth curve of mutant UV6-69 at 0.03 g/L, 0.05 g/L, 0.08 g/L, 0.10 g/L, 0.13 g/L, 0.15 g/L, and 0.25 g/L ethionine. b Growth curve of mutants at 0.13 g/L, 0.15 g/L, 0.16 g/L, 0.18 g/L, and 0.24 g/L ethionine. OD value at mark ① and ② is not displayed normally because of memory overflow. c Growth curve of mutants at 0.25 g/L ethionine. d Growth curves of 3 ethionine-resistant mutants obtained by MMC under 0.25 g/L ethionine as pressure
The MMC adaption was carried out by incubating 5 cycles at 0.13 g/L ethionine, 5 cycles at 0.15 g/L ethionine, 5 cycles at 0.16 g/L ethionine, 5 cycles at 0.18 g/L ethionine, 2 cycles at 0.24 g/L ethionine (Fig. 2b), and then further incubated 39 cycles at 0.24 g/L ethionine (Fig. 2c). After adaptive evolution, 3 droplets (No. 11, No. 27, and No. 40) with higher OD600 values were collected (Fig. 2d) and spread on YPD agar plates containing 0.25 g/L ethionine. Three mutants (T11-1, T27-1, and T40-1) were isolated from the plates. The growth and SAM titer of the 3 mutants were determined by shake flask fermentation with YPD medium. After 24 h incubation, the biomass of T11-1, T27-1 and T40-1 was 21.7%, 18.57% and 22.16% higher than that of mutant UV6-69. The SAM titers of T11-1, T27-1 and T40-1 were 1.33 g/L, 1.08 g/L and 0.85 g/L, respectively, whereas SAM titer of mutant UV6-69 was 1.17 g/L. The SAM titer of T11-1 was 13.7% higher than that of mutant UV6-69.
It was proposed that mutants with higher ethionine tolerance may possess higher SAM synthetase activity which was helpful for SAM synthesis (Cao et al. 2012). Interestingly, significant difference in SAM titer among mutants T11-1, T27-1 and T40-1 were observed. This might be due to the complexity in SAM metabolism of the strain which involves various reactions and enzymes (Chen et al. 2016a).
Genetic stability of mutants
For genetic stability determination, mutant UV6-69, 11–1 and 27–1 were subcultured consecutively for 10 generations. SAM titer of 4 colonies of the mutant from each generation was examined in shake flask fermentation (Fig. 3). As depicted in Fig. 3, the SAM titers of the first and tenth generation of mutant UV6-69 were 1.21 g/L and 1.17 g/L, respectively. Whereas the SAM titers of the first and tenth generation of mutant T11-1 were 1.34 g/L and 1.3 g/L, respectively. Therefore, mutant T11-1 possessed excellent genetic stability. Thus, mutant T11-1 was chosen for further experiment.
Fig. 3.

Genetic stability of mutant UV6-69, T11-1, and T27-1 in shake flask fermentation. The shake flasks were incubated for 24 h at 30 °C and 180 rpm. Values are presented as mean ± standard deviation for three independent experiments
Effect of temperature on SAM titer of mutant T11-1 in 5 L bioreactor
The effect of temperature on SAM titer and growth of mutant T11-1 was firstly examined in shake flask fermentation (Fig. 4a). As depicted in Fig. 4a, mutant T11-1 displayed the maximal SAM titer and biomass (1.31 g/L and 7.3 g/L, respectively) at 30 °C. Therefore, the optimal temperature for mutant T11-1 in shake flask fermentation was 30 °C. To investigate the effect of temperature on SAM titer and growth in 5 L bioreactor, DO and pH were maintained at 40% and 5.5, respectively (Fig. 4b). As depicted in Fig. 4b, the highest SAM titer of mutant T11-1 at 27 °C, 30 °C and 33 °C were 7.56 g/L, 10.72 g/L and 9.05 g/L, respectively. With the maximal SAM titer, 30 °C was chosen as the optimal temperature, which was consistent with the data in shake flask fermentation.
Fig. 4.

Effect of temperature on SAM titer of mutant T11-1 in shake flask and 5 L bioreactor. a SAM titer of mutant T11-1 in shake flask incubated for 24 h at various temperatures (24 °C, 27 °C, 30 °C, 33 °C, and 36 °C) and 180 rpm. b SAM titer of mutant T11-1 in 5 L bioreactor at various temperatures (27 °C, 30 °C and 33 °C) and 40% DO. In 5 L bioreactor, samples were withdrawn after addition of L-methionine for 52 h. Values are presented as mean ± standard deviation for three independent experiments
Effect of pH on growth and SAM titer of mutant T11-1 in 5 L bioreactor
It is reported that acidic conditions are suitable for SAM production by S. cerevisiae. Effect of pH on growth and SAM titer of mutant T11-1 was examined in 5 L bioreactor at 30 °C and 40% DO (Fig. 5). As depicted in Fig. 5, the highest SAM titer of mutant T11-1 at pH 4.5, pH 5.0, pH 5.5 and pH 6.0 were 6.80 g/L, 9.68 g/L, 10.54 g/L and 7.93 g/L, respectively. With the maximal biomass and SAM titer, pH 5.5 was chosen as the optimal pH value.
Fig. 5.

Effect of various pH (4.5, 5.0, 5.5 and 6.0) on SAM titer of mutant T11-1 in 5 L bioreactor at 30 °C and. Samples were withdrawn after addition of L-methionine for 52 h. Values are presented as mean ± standard deviation for three independent experiments
Effect of DO on SAM titer of mutant T11-1 in 5 L bioreactor
Effect of DO concentration (20%, 30%, 40%, and 50%) on SAM production and growth of mutant T11-1 in 5 L bioreactor at 30 °C and pH 5.5 was examined (Fig. 6). As depicted in Fig. 6, the maximal SAM titer of mutant T11-1 incubated at 20%, 30%, 40%, and 50% DO reached 7.59 g/L, 10.54 g/L, 10.72 g/L, and 9.73 g/L, respectively. Therefore, 30% and 40% DO were more suitable for mutant T11-1. Moreover, there was no significant difference in SAM titer when mutant was incubated at 30% and 40% DO. With slightly higher SAM titer and biomass, 40% DO was selected for further research.
Fig. 6.

Effect of various DO concentrations (20%, 30%, 40%, and 50%) on SAM titer of mutant T11-1 in 5 L bioreactor at 30 °C and pH 5.5. Samples were withdrawn after addition of L-methionine for 52 h. Values are presented as mean ± standard deviation for three independent experiments
Time course of mutant T11-1 and ZY 1–5 in 5 L bioreactor
SAM productions of strain ZY 1–5 and mutant T11-1 in 5 L bioreactor were performed at 30 °C, 40% DO and pH 5.5 (Fig. 7). As depicted in Fig. 7, the maximal biomass of strain ZY 1–5 and mutant T11-1 were 105.9 g/L and 78.9 g/L, respectively. The maximal SAM titers of strain ZY 1–5 and mutant T11-1 were 10.72 g/L and 4.42 g/L, respectively. The biomass and SAM titer of mutant T11-1 were 34.22% and 142.86% than those of strain ZY 1–5.
Fig. 7.

Time course of mutant T11-1 and ZY 1–5 in 5 L bioreactor at 30 °C, 40% DO and pH 5.5. a SAM titer, b biomass. Values are presented as mean ± standard deviation for three independent experiments
Up to date, various mutagenesis methods such as UV irradiation had been carried out to improve SAM productivity of yeasts. With UV-mutagenesis and nastiyn-resistance screening, mutants from S. cerevisiae K-9 displayed much higher SAM titer than the parental strain (Shobayashi et al. 2006). With UV-LiCl complex mutation, SAM titer of mutant SAM-06 from S. sake yabe SAM-04–01 in shake flask reached 1.0 g/L, increased by 17% than that of the parent strain (Dong et al. 2006). By continuous feed of L-methionine and glucose, SAM titer of mutant SAM-06 further reached 5.34 g/L in 5 L bioreactor. Although mutant UV K6-1 (derived from UV mutagenesis of S. cerevisiae sake K6) displayed no significant difference in cell growth and SAM accumulation with its parent strain, it provided a marker for genetic manipulation (Choi et al. 2009). With UV-diethyl sulfate composite mutagenesis and protoplast fusion, SAM titer of mutant F35 in shake flask fermentation reached 22.5 mg/L, increased by 103% than that of the parent strain S. cerevisiae R1 (Feng and Wang, 2011). With successive UV mutagenesis and ethionine-resistant screening, SAM titer of mutant S. cerevisiae CGMCC 2482 in 15 L bioreactor reached 6.1 g/L with fed-batch fermentation, increased by 330% than that of the parent strain S. cerevisiae CGMCC 1226 (Cao et al. 2012). With space flight cultivation, SAM titer of mutant S. cerevisiae H5M147 reached 2.25 g/L in shake flask fermentation, increased by 86.89% than the parent strain S. cerevisiae H5 (Huang et al. 2012). By UV mutagenesis-cordycepin resistant screening, SAM accumulation in mutant NY9-1 and NY9-10 reached above 80 mg/g dcw, which was almost four times of that of the parental strain S. cerevisiae K9 (Kanai et al. 2019). Recently, with ARTP-137Cs γ-ray composite mutagenesis, ethionine and nystatin screening, SAM titer of mutant AC-10 from S. cerevisiae ZY reached 1.15 g/L in shake flask fermentation, increased by 130% compared with the parent strain. SAM titer of mutant AC-10 further reached 5.62 g/L in 5 L bioreactor with fed-batch fermentation (Qin et al. 2020). Compared to the above mutants, mutant T11-1 possessed excellent SAM productivity and can serve as a potential candidate for large scale SAM production.
Identification of significantly differentially expressed genes (DEGs) by transcriptome analysis
Due to the uncertainty of mutagenesis, mutant T11-1 may circumvent the screening pressure through the other uncertain metabolic pathways. To provide a theoretical basis for the improvement of SAM production, transcriptome analysis was used to sequence the origin strain ZY1-5 and high-SAM titer mutant strain T11-1. By reference to Gene Ontology (GO), Clusters of Orthologous Genes (COG) and Kyoto Encyclopedia of Genes and Genomes (KEGG) databases, transcriptome analysis and alignment were successfully performed. The expressions of 1104 identified genes were either upregulated or downregulated between origin strain ZY1-5 and mutant strain T11-1 (514 upregulated genes and 590 downregulated genes). All 1104 DEGs were plotted in the volcano plot and the MA plot, as shown in Fig. 8. The degree of upregulation and downregulation of genes were relatively high, and most of them were in the log2FC -6 ~ 6 interval. The top 50 DEGs (25 upregulated and 25 downregulated) were shown in Table 1. Based on these top DEGs, significantly distinct pattern was observed between ZY1-5 and T11-1, which indicated that the top DEGs can be used to show the difference between the two groups.
Fig. 8.
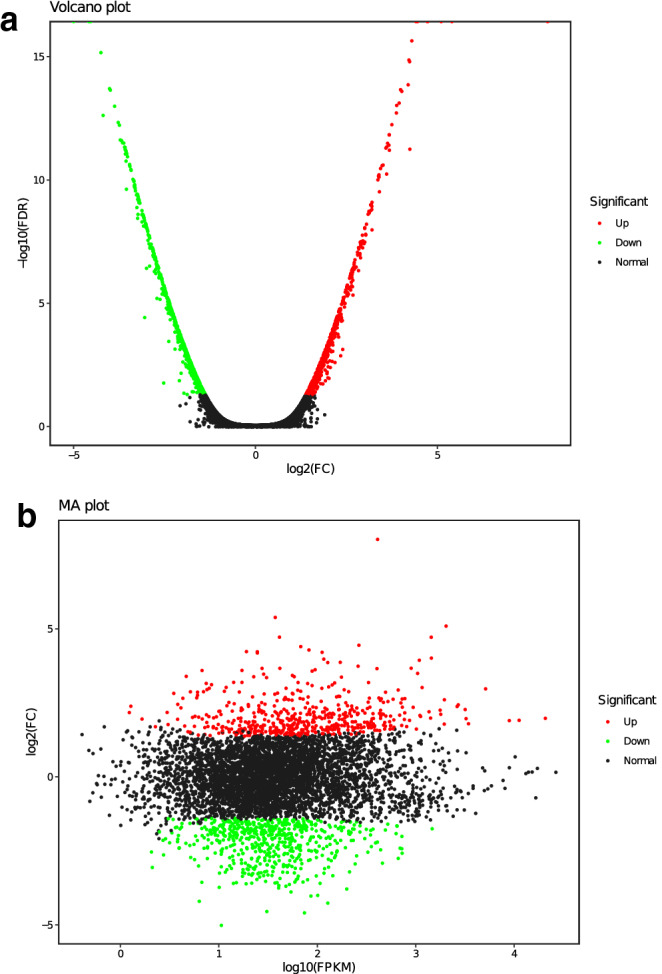
Distribution of DEGs between strain ZY1-5 and mutant T11-1. a volcano plot b MA plot. Red: significant UP-DEGs in mutant T11-1. Green: significant DOWN-DEGs in mutant T11-1. All differential genes were utilized for volcano plot
Table 1.
The 25 upregulated DEGs and 25 downregulated DEGs with lowest FDR
| Gene | FPKM (ZY1-5) | FPKM (T11-1) | FDR | log2FC | Regulated |
|---|---|---|---|---|---|
| INO1 | 3.24 | 814.31 | 0 | 8.03 | up |
| LYS4 | 1.71 | 72.90 | 0 | 5.40 | up |
| EGO4 | 126.92 | 3931.61 | 0 | 5.10 | up |
| RGI2 | 2.63 | 79.74 | 0 | 4.73 | up |
| HXK1 | 116.21 | 2750.98 | 0 | 4.73 | up |
| CHA1 | 25.34 | 502.70 | 0 | 4.46 | up |
| GIT1 | 6.56 | 128.93 | 0 | 4.41 | up |
| REG2 | 8.51 | 155.66 | 2.22 × 10⁻¹⁶ | 4.30 | up |
| YBR056C-B | 0.00 | 38.04 | 5.51 × 10⁻¹² | 4.24 | up |
| YMR206W | 2.37 | 46.65 | 1.55 × 10⁻¹⁵ | 4.23 | up |
| YFR052C-A | 11.50 | 211.79 | 1.33 × 10⁻¹⁵ | 4.22 | up |
| SPL2 | 2.07 | 47.00 | 1.34 × 10⁻¹⁴ | 4.19 | up |
| SPI1 | 184.84 | 2690.86 | 2.49 × 10⁻¹⁴ | 4.02 | up |
| URA10 | 14.84 | 217.32 | 2.12 × 10⁻¹⁴ | 3.99 | up |
| OPI3 | 146.37 | 2023.82 | 7.41 × 10⁻¹⁴ | 3.95 | up |
| YEL073C | 23.19 | 318.44 | 9.26 × 10⁻¹⁴ | 3.88 | up |
| ADR1 | 18.03 | 236.61 | 1.87 × 10⁻¹³ | 3.87 | up |
| YGL121C | 39.08 | 479.34 | 5.56 × 10⁻¹³ | 3.75 | up |
| GPG1 | 144.20 | 1649.16 | 6.05 × 10⁻¹² | 3.68 | up |
| ACS1 | 6.55 | 76.60 | 1.42 × 10⁻¹² | 3.68 | up |
| ICL2 | 4.22 | 50.56 | 1.45 × 10⁻¹² | 3.67 | up |
| JEN1 | 65.20 | 740.60 | 3.78 × 10⁻¹² | 3.67 | up |
| PHO84 | 15.56 | 174.05 | 3.17 × 10⁻¹² | 3.63 | up |
| PDH1 | 2.68 | 31.58 | 4.49 × 10⁻¹² | 3.61 | up |
| UTP10 | 41.59 | 4.24 | 2.36 × 10⁻⁹ | – 3.11 | down |
| DHR2 | 31.98 | 3.14 | 1.69 × 10⁻⁹ | – 3.12 | down |
| DRS1 | 55.74 | 5.34 | 8.44 × 10⁻¹⁰ | – 3.18 | down |
| MAK21 | 64.43 | 6.20 | 8.25 × 10⁻¹⁰ | – 3.19 | down |
| HPT1 | 387.05 | 37.12 | 8.00 × 10⁻¹⁰ | – 3.20 | down |
| MAK5 | 53.25 | 5.04 | 6.59 × 10⁻¹⁰ | – 3.20 | down |
| UTP5 | 81.28 | 7.69 | 6.28 × 10⁻¹⁰ | – 3.21 | down |
| MKC7 | 21.32 | 1.89 | 8.00 × 10⁻¹⁰ | – 3.21 | down |
| KAP123 | 90.50 | 8.59 | 6.74 × 10⁻¹⁰ | – 3.22 | down |
| UTP9 | 31.98 | 2.88 | 5.38 × 10⁻¹⁰ | – 3.22 | down |
| SYO1 | 49.10 | 4.51 | 4.59 × 10⁻¹⁰ | – 3.23 | down |
| RPA135 | 106.70 | 10.05 | 6.16 × 10⁻¹⁰ | – 3.23 | down |
| FUR4 | 18.65 | 1.60 | 5.85 × 10⁻¹⁰ | – 3.24 | down |
| SNU13 | 213.89 | 19.33 | 3.83 × 10⁻¹⁰ | – 3.24 | down |
| UTP6 | 40.56 | 3.54 | 3.65 × 10⁻¹⁰ | – 3.26 | down |
| RPA12 | 46.28 | 3.47 | 1.28 × 10⁻⁹ | – 3.26 | down |
| ESF2 | 37.18 | 3.10 | 3.93 × 10⁻¹⁰ | – 3.27 | down |
| TSR2 | 58.08 | 4.72 | 2.68 × 10⁻¹⁰ | – 3.30 | down |
| RCL1 | 39.67 | 3.29 | 2.11 × 10⁻¹⁰ | – 3.31 | down |
| RPF2 | 63.71 | 5.38 | 1.52 × 10⁻¹⁰ | – 3.32 | down |
| TRM8 | 52.56 | 4.32 | 1.71 × 10⁻¹⁰ | – 3.33 | down |
| DBP2 | 263.62 | 23.24 | 1.89 × 10⁻¹⁰ | – 3.33 | down |
| PLB2 | 179.10 | 15.68 | 1.63 × 10⁻¹⁰ | – 3.34 | down |
| HAS1 | 117.67 | 10.14 | 1.12 × 10⁻¹⁰ | – 3.34 | down |
| SPB1 | 31.97 | 2.67 | 1.03 × 10⁻¹⁰ | – 3.35 | down |
DEG differentially expressed genes, FPKM fragments per kilobase per million mapped fragments, FDR false discovery rate, FC fold change
Construction of protein–protein interaction network
STRING analysis of the top significant DEGs revealed 141 nodes and 1901 edges (Fig. 9). The modules were determined based on the PPI network (Fig. 9). 5 proteins formed module A, including phosphoglucomutase (PGM2), glycogen debranching enzyme (GDB1), glycogen synthase (GSY2), glycogen phosphorylase (GPH1) and 5'-(N(7)-methyl 5'-triphosphoguanosine)-(mRNA) diphosphatase (DCS2). Four proteins formed module B, including methylenetetrahydrofolate reductase (NADPH) (MET13), amino methyltransferase (GCV1), glycine dehydrogenase (GCV2) and methylenetetrahydrofolate dehydrogenase (NAD+) (MTD1). GO term enrichment analyses and KEGG pathway analyses of DEGs were performed. GO enrichment analysis revealed 1017 DEGs annotated into 40 GO entries (Fig. 10). For the molecular function domain, DEGs were significantly enriched in the N-methyltransferase activity, electron carrier activity, isocitrate dehydrogenase activity, etc. (Table 2). For the biological process domain, DEGs were significantly enriched in the maturation of LSU-rRNA, maturation of SSU-rRNA from tricistronic rRNA transcript (SSU-rRNA, 5.8S rRNA, LSU-rRNA), ribosome biogenesis, respiratory electron transport chain, maturation of SSU-rRNA, maturation of 5.8S rRNA, citrate metabolic process and RNA methylation, etc. (Table 2). For the cellular component domain, DEGs were significantly enriched in the nuclear lumen, preribosome, nucleolar part, 90S preribosome and nucleoplasm part, etc. (Table 2).
Fig. 9.

The protein–protein interaction network of differentially expressed genes (DEGs) between mutant T11-1 and origin strain ZY 1–5. The 141 significant DGEs were employed for PPI network construction. Each node represented a protein, and each connection represented an interaction. Module A and B were the most significantly enriched functional protein modules. Module A: Glucose metabolism. Module. B: THF metabolism module. The cutoff for module filtration is: MCODE score > 3, and nodes > 3
Fig. 10.

DEGs GO annotation classification statistics map. The DEGs were demonstrated in each of the three ontologies: biological process, cellular component, molecular function
Table 2.
The top nodes in GO enrichment analysis
| Term ID | Term description | Annotated genes | Significant DEGs | False discovery rate |
|---|---|---|---|---|
| Molecular function | ||||
| GO:0003899 | DNA-directed 5'-3' RNA polymerase activity | 32 | 20 | 2.57 × 10⁻⁵ |
| GO:0003724 | RNA helicase activity | 26 | 17 | 7.50 × 10⁻⁵ |
| GO:0003723 | RNA binding | 185 | 58 | 0.0118 |
| GO:0000166 | Nucleotide binding | 86 | 30 | 0.032 |
| GO:0008170 | N-methyltransferase activity | 27 | 11 | 0.0368 |
| GO:0009055 | Electron carrier activity | 13 | 8 | 0.0441 |
| GO:0003676 | Nucleic acid binding | 828 | 190 | 0.0465 |
| GO:0004448 | Isocitrate dehydrogenase activity | 6 | 5 | 0.0492 |
| Biological process | ||||
| GO:0000470 | Maturation of LSU-rRNA | 43 | 31 | 6.02 × 10⁻¹² |
| GO:0000462 | Maturation of SSU-rRNA from tricistronic rRNA transcript (SSU-rRNA, 5.8S rRNA, LSU-rRNA) | 39 | 29 | 2.69 × 10⁻¹¹ |
| GO:0042254 | Ribosome biogenesis | 298 | 162 | 3.89 × 10⁻¹⁰ |
| GO:0022904 | Respiratory electron transport chain | 19 | 16 | 2.55 × 10⁻⁷ |
| GO:0030490 | Maturation of SSU-rRNA | 82 | 55 | 2.84 × 10⁻⁷ |
| GO:0000460 | Maturation of 5.8S rRNA | 18 | 15 | 7.69 × 10⁻⁷ |
| GO:0006101 | Citrate metabolic process | 31 | 19 | 2.40 × 10⁻⁵ |
| GO:0001510 | RNA methylation | 36 | 23 | 5.34 × 10⁻⁵ |
| GO:0022618 | Ribonucleoprotein complex assembly | 100 | 36 | 2.36 × 10⁻⁴ |
| GO:0000154 | rRNA modification | 16 | 14 | 9.05 × 10⁻⁴ |
| GO:0022613 | Ribonucleoprotein complex biogenesis | 383 | 185 | 1.58 × 10⁻³ |
| Cellular component | ||||
| GO:0031981 | Nuclear lumen | 623 | 220 | <1 × 10–20 |
| GO:0030684 | Preribosome | 163 | 112 | <1 × 10–20 |
| GO:0044452 | Nucleolar part | 30 | 19 | 5.30 × 10⁻⁸ |
| GO:0030686 | 90S preribosome | 22 | 16 | 1.84 × 10⁻⁶ |
| GO:0044451 | Nucleoplasm part | 152 | 27 | 4.44 × 10⁻⁴ |
| GO:0005739 | Mitochondrion | 413 | 87 | 2.09 × 10⁻² |
| GO:0005618 | Cell wall | 89 | 23 | 6.80 × 10⁻² |
| GO:0098857 | Membrane microdomain | 21 | 9 | 0.1746 |
| GO:0005732 | Small nucleolar ribonucleoprotein complex | 18 | 8 | 0.1825 |
| GO:0019866 | Organelle inner membrane | 235 | 49 | 0.2284 |
GO gene ontology; DEG differentially expressed genes
Top 20 KEGG pathways with the highest enrichment were marked in Fig. 11. In S. cerevisiae, the biosynthesis of SAM was affected by the expression of SAM synthase, the level of ATP, the metabolism of SAM and the energy supply. 5 KEGG pathways met the above conditions: Steroid biosynthesis (ko00100), Glycolysis/gluconeogenesis (ko00010), Pentose Phosphate pathway (ko00030), TCA cycle (ko00020) and oxidative phosphorylation (ko00190).
Fig. 11.

Statistics of KEGG enrichment. The top 20 enriched pathways were showed. The size of each symbol represented the number of included genes in the pathway. The shape of each symbol demonstrated the upregulation or downregulation of each pathway in mutant T11-1
Cell component enrichment (GO) analysis showed that in biological process domain, DEGs are mainly concentrated in rRNA maturation, ribosome biogenesis and respiratory electron transport chain (Table 2). SAM is an important methyl donor in cells and plays an important role in the maturation of RNA (methylation cap structure), while most gene transcription takes place on the ribosome. The existence of respiratory electron transport chain based on oxidative phosphorylation, in KEGG pathway oxidative phosphorylation, the expressions of many subunits in oxidoreductase complexes II, III, IV and V were enhanced. This indicated that mutant T11-1 could get energy more efficiently. At the same time, the conversion efficiency from ADP to ATP was also improved, and provided more energy in biosynthesis of SAM. All these showed that at the biological process domain, most DEGs between the mutant T11-1 and the original strain 1–5 was relevant to SAM metabolism.
In KEGG pathway steroid biosynthesis (ko00100), expression of Delta7-sterol 5-desaturase (ERG3) and Delta24 (24(1))-sterol reductase (ERG4) were downregulated. Shobayashi et al. (Shobayashi et al. 2006) obtained S. cerevisiae K-9 using nystatin for ergosterol biosynthesis-deficient strain screening. They confirmed that inhibition of ERG4 can lead to accumulation of SAM. This proved that inhibition of ergosterol biosynthesis pathway can reduce SAM consumption and increase SAM accumulation in mutant T11-1.
In mutant T11-1, upregulation of the transaldol carboxylase NQM1 was observed, but studies have also shown that this gene only has little effect on the pentose phosphate pathway (Matsushika et al. 2012). Up-regulation of glucokinase (GLK1), F-box protein 43 (EMI2) and hexokinase (HXK1) might increase the level of glucose-6-phosphate as hexokinases catalyze (Herrero et al., 1995). Umekawa et al. confirmed that EMI2 was a hexokinase expressed in early meiotic induction when glucose was limited (Umekawa et al. 2020). Up-regulation of fructose-1,6-bisphosphatase (FBP1) might increase the level of fructose-6-phosphate and glucose-6-phosphate. Fructose-6-phosphate can be interconverted to glucose-6-phosphate, and glucose 6-phosphate is a precursor of many important cofactors and plays an important role in cell growth (Cregg et al. 1985). Up-regulation of enolase (ENO1) and phosphoenolpyruvate carboxykinase might increase the level of phosphoenolpyruvate. Phosphoenolpyruvate is the precursor of pyruvate which is the beginning component of TCA cycle, so its concentration represents the ability of yeast to obtain energy (Kim et al. 2010).
The expression of key enzymes, such as citrate synthase (CIT2), isocitrate dehydrogenase (IDP2, IDP3), isocitrate dehydrogenase (IDH1, IRC4, IDH2), succinyl-CoA synthetase (LSC2), succinate dehydrogenase (SDH1, SDH2, SDH3, SDH4) and malate dehydrogenase (MDH1) in TCA cycle was upregulated, which indicated that the ability of S. cerevisiae T11-1 to generate energy by decomposing fatty acids, glucose, amino acids, etc. (Kim et al. 2010) was greatly enhanced, and the ability to obtain ATP was greatly improved.
In conclusion, compared with the initial strain ZY 1–5, the biosynthesis of ergosterol in mutant T11-1 was inhibited, which indirectly reduced the consumption of SAM. The TCA cycle and gluconeogenesis/glycolysis pathways in T11-1 were enhanced, which indicated that the ability of T11-1 to metabolize glucose and biosynthesis of ATP was significantly enhanced compared to ZY1-5.
Conclusion
Due to its important applications, efficient production of SAM is of great importance. In present study, to improve the SAM production in S. cerevisiae ZY 1–5, ARTP and UV-LiCl mutagenesis were carried out on this strain. Ethionine, L-methionine, nystatin and cordycepin were used as screening agents for the screening of mutants. Adaptive evolution of one of the mutants were further performed with MMC using ethionine as screening pressure. Fermentation conditions of the resultant mutant, mutant T11-1 were optimized in 5 L bioreactor. After mutagenesis, adaptive evolution and fermentation conditions optimization, growth and SAM titer of mutant T11-1 reached 105.9 g/L and 10.72 g/L, respectively. Comparative transcriptome analysis indicated that the improved SAM productivity of mutant T11-1 may ascribe to the enhancement of ATP synthesis and inhibition of SAM depletion. The present research revealed the efficiency of ARTP in mutation breeding of microorganisms and the feasibility of MMC in adaptive evolution of microorganisms. To the best of our knowledge, this is the first report on improving SAM productivity of S. cerevisiae with adaptive evolution using MMC. The comparative transcriptome analysis not only primarily reveals the possible mechanisms for SAM productivity improvement of mutant T11-1 but also provides useful information for future strain improvement. Moreover, with excellent SAM productivity, mutant T11-1 may serve as a promising candidate for large scale SAM producing.
Acknowledgements
This research is supported by National Key R&D Program of China (2020YFA0907900), Ministry of Science and Technology of the People´s Republic of China, and Zhejiang Provincial Natural Science Foundation (No. LY22C010005, LY17C010005).
Author contributions
MZ, LM and QH, implementation of the experiment, preparation of manuscript. WY, QH, WC, LZ, English check. WY, WC, HZ, LZ and ZY supervision, experimental program design.
Funding
Ministry of Science and Technology of the People’s Republic of China, 2020YFA0907900, Yuanshan Wang, Natural Science Foundation of Zhejiang Province,LY22C010005, Chunyue Weng, LY17C010005, Yuanshan Wang
Declarations
Conflict of interest
The authors declare that they have no known competing financial interests or personal relationships that could have appeared to influence the work reported in this paper.
Contributor Information
Chunyue Weng, Email: cweng@zjut.edu.cn.
Zheyan Mi, Email: 47138675@qq.com.
Meijing Li, Email: 2573984723@qq.com.
Haibin Qin, Email: qinhaibin@zjut.edu.cn.
Zhongce Hu, Email: zhongce@zjut.edu.cn.
Zhiqiang Liu, Email: microliu@zjut.edu.cn.
Yuguo Zheng, Email: zhengyg@zjut.edu.cn.
Yuanshan Wang, Email: yuanshan@zjut.edu.cn.
References
- Beneyton T, Wijaya I, Postros P, et al. High-throughput screening of filamentous fungi using nanoliter-range droplet-based microfluidics. Sci Rep. 2016;6(1):1–10. doi: 10.1038/srep27223. [DOI] [PMC free article] [PubMed] [Google Scholar]
- Cao X, Yang M, Xia Y, et al. Strain improvement for enhanced production of S-adenosyl-L-methionine in Saccharomyces cerevisiae based on ethionine-resistance and SAM synthetase activity. Ann Microbiol. 2012;62(4):1395–1402. doi: 10.1007/s13213-011-0389-0. [DOI] [Google Scholar]
- Chan SY, Appling DR. Regulation of S-adenosylmethionine levels in Saccharomyces cerevisiae. J Biol Chem. 2003;278(44):43051–43059. doi: 10.1074/jbc.M308696200. [DOI] [PubMed] [Google Scholar]
- Chen YW. Cofactor engineering strategy for enhanced S-adenosylmethionine production in Saccharomyces cerevisiae. Chin J Biotechnol. 2018;34(2):246–254. doi: 10.13345/j.cjb.170174. [DOI] [PubMed] [Google Scholar]
- Chen H, Wang Z, Cai H, et al. Progress in the microbial production of S-adenosyl-L-methionine. World J Microbiol Biotechnol. 2016;32(9):1–8. doi: 10.1007/s11274-016-2102-8. [DOI] [PubMed] [Google Scholar]
- Chen H, Wang Z, Wang Z, et al. Improving methionine and ATP availability by MET6 and SAM2 co-expression combined with sodium citrate feeding enhanced SAM accumulation in Saccharomyces cerevisiae. World J Microbiol Biotechnol. 2016;32(4):1–10. doi: 10.1007/s11274-016-2010-y. [DOI] [PubMed] [Google Scholar]
- Chen H, Zhu N, Wang Y, et al. Increasing glycolysis by deletion of kcs1 and arg82 improved S-adenosyl-L-methionine production in Saccharomyces cerevisiae. AMB Express. 2021;11(1):1–16. doi: 10.1186/s13568-021-01179-8. [DOI] [PMC free article] [PubMed] [Google Scholar]
- Choi E, Park B, Lee S, et al. Increased production of S-adenosyl-L-methionine using recombinant Saccharomyces cerevisiae sake K6. Korean J Chem Eng. 2009;26(1):156–159. doi: 10.1007/s11814-009-0025-x. [DOI] [Google Scholar]
- Cregg JM, Hessler BK, A,, et al. Pichia pastoris as a host system for transformations. Mol Cell Biol. 1985;5(12):3376–3385. doi: 10.1128/mcb.5.12.3376-3385.1985. [DOI] [PMC free article] [PubMed] [Google Scholar]
- Dong H, Liu F, Tan T. Study on screening the strain yielding highly s-adenosylmethionine by complex mutation and its culture manner. Chin J Bioprocess Eng. 2006;4(2):20–23. [Google Scholar]
- Feng XX, Wang YQ. Breeding of Saccharomyces cerevisiae giving an enhanced yield of S-adenosyl-L-methionine by composite mutagenesis and protoplast fusion. J Beijing Uni Chem Technol. 2011;38(6):87–92. [Google Scholar]
- Fontecave M, Atta M, Mulliez E. S-adenosylmethionine: nothing goes to waste. Trends Biochem Sci. 2004;29(5):243–249. doi: 10.1016/j.tibs.2004.03.007. [DOI] [PubMed] [Google Scholar]
- Guo X, Wang L, Zhang C, et al. Technology development and instrumentation of a high-throughput and automated microbial microdroplet culture system for microbial evolution and screening. Chin J Biotechnol. 2021;37(3):991–1003. doi: 10.13345/j.cjb.200667. [DOI] [PubMed] [Google Scholar]
- Herrero P, Galindez J, Ruiz N, et al. Transcriptional regulation of the Saccharomyces cerevisiae HXK1, HXK2 and GLK1 genes. Yeast. 1995;11(2):137–144. doi: 10.1002/yea.320110205. [DOI] [PubMed] [Google Scholar]
- Huang Y, Gou X, Hu H, et al. Enhanced S-adenosyl-L-methionine production in Saccharomyces cerevisiae by spaceflight culture, overexpressing methionine adenosyltransferase and optimizing cultivation. J Appl Microbiol. 2012;112(4):683–694. doi: 10.1111/j.1365-2672.2012.05251.x. [DOI] [PubMed] [Google Scholar]
- Jian X, Guo X, Wang J, et al. Microbial microdroplet culture system (MMC): an integrated platform for automated, high-throughput microbial cultivation and adaptive evolution. Biotechnol Bioeng. 2020;117(6):1724–1737. doi: 10.1002/bit.27327. [DOI] [PubMed] [Google Scholar]
- Kanai M, Yasuda N, Morimoto T, et al. Breeding of a cordycepin-resistant and adenosine kinase-deficient sake yeast strain that accumulates high levels of S-adenosylmethionine. Biosci Biotechnol. 2019;83(8):1530–1537. doi: 10.1080/09168451.2019.1571896. [DOI] [PubMed] [Google Scholar]
- Kim SY, Choi JS, Park C, et al. Ethyl pyruvate stabilizes hypoxia-inducible factor 1 alpha via stimulation of the TCA cycle. Cancer Lett. 2010;295(2):236–241. doi: 10.1016/j.canlet.2010.03.006. [DOI] [PubMed] [Google Scholar]
- Lee SW, Park BS, Choi ES, et al. Overexpression of ethionine resistance gene for maximized production of S-adenosylmethionine in Saccharomyces cerevisiae sake kyokai No. 6. Korean J Chem Eng. 2010;27(2):587–589. doi: 10.1007/s11814-010-0100-3. [DOI] [Google Scholar]
- Leng N, Dawson JA, Thomson JA, et al. EBSeq: an empirical Bayes hierarchical model for inference in RNA-seq experiments. Bioinformatics. 2013;29(8):1035–1043. doi: 10.1093/bioinformatics/btt087. [DOI] [PMC free article] [PubMed] [Google Scholar]
- Li G, Li H, Tan Y, et al. Improved S-adenosyl-l-methionine production in Saccharomyces cerevisiae using tofu yellow serofluid. J Biotechnol. 2020;309:100–106. doi: 10.1016/j.jbiotec.2020.01.004. [DOI] [PubMed] [Google Scholar]
- Lin JP, Tian J, You JF, et al. An effective strategy for the co-production of S-adenosyl-L-methionine and glutathione by fed-batch fermentation. Biochem Eng J. 2004;21(1):19–25. doi: 10.1016/j.bej.2004.04.013. [DOI] [Google Scholar]
- Liu W, Tang D, Shi R, et al. Efficient production of S-adenosyl-l-methionine from dl-methionine in metabolic engineered Saccharomyces cerevisiae. Biotechnol Bioeng. 2019;116(12):3312–3323. doi: 10.1002/bit.27157. [DOI] [PubMed] [Google Scholar]
- Matsushika A, Goshima T, Fujii T, et al. Characterization of non-oxidative transaldolase and transketolase enzymes in the pentose phosphate pathway with regard to xylose utilization by recombinant Saccharomyces cerevisiae. Enzyme Microb Tech. 2012;51(1):16–25. doi: 10.1016/j.enzmictec.2012.03.008. [DOI] [PubMed] [Google Scholar]
- Qin HB, Niu K, Wang YS. Mutation breeding of S-adenosylmethionine-producing yeast. Food Ferment Ind. 2020;46(21):23–27. doi: 10.13995/j.cnki.11-1802/ts.024211. [DOI] [Google Scholar]
- Schlenk F, Zydek CR, Ehninger DJ, et al. The production of S-adenosyl-L-methionine and S-adenosyl-L-ethionine by yeast. Enzymologia. 1965;29(3):283–298. [PubMed] [Google Scholar]
- Shobayashi M, Mukai N, Iwashita K, et al. A new method for isolation of S-adenosylmethionine (SAM)-accumulating yeast. Appl Microbiol Biotechnol. 2006;69(6):704–710. doi: 10.1007/s00253-005-0009-7. [DOI] [PubMed] [Google Scholar]
- Trapnell C, Williams BA, Pertea G, et al. Transcript assembly and quantification by RNA-seq reveals unannotated transcripts and isoform switching during cell differentiation. Nat Biotechnol. 2010;28(5):511–515. doi: 10.1038/nbt.1621. [DOI] [PMC free article] [PubMed] [Google Scholar]
- Umekawa M, Hamada K, Isono N, et al. The Emi2 protein of Saccharomyces cerevisiae is a hexokinase expressed under glucose limitation. J Appl Microbiol. 2020;67(4):103–109. doi: 10.5458/jag.jag.JAG-2020_0007. [DOI] [PMC free article] [PubMed] [Google Scholar]
- Wang L, Zhao H, He D, et al. Insights into the molecular-level effects of atmospheric and room-temperature plasma on mononucleotides and single-stranded homo-and hetero-oligonucleotides. Sci Rep. 2020;10(1):1–11. doi: 10.1038/s41598-020-71152-1. [DOI] [PMC free article] [PubMed] [Google Scholar]
- Zhang X, Zhang XF, Li HP, et al. Atmospheric and room temperature plasma (ARTP) as a new powerful mutagenesis tool. Appl Microbiol Biotechnol. 2014;98(12):5387–5396. doi: 10.1007/s00253-014-5755-y. [DOI] [PubMed] [Google Scholar]
- Zhao W, Shi F, Hang B, et al. The improvement of SAM accumulation by integrating the endogenous methionine adenosyltransferase gene SAM2 in genome of the industrial Saccharomyces cerevisiae strain. Appl Biochem Biotechnol. 2016;178(6):1263–1272. doi: 10.1007/s12010-015-1943-1. [DOI] [PubMed] [Google Scholar]
- Zhao WJ, Huang L, Xu ZN. Research progress on the synthesis of S-adenosyl-L-methionine in microorganism. Biol Bull. 2017;33(1):99–105. doi: 10.13560/j.cnki.biotech.bull.1985.2017.01.010. [DOI] [Google Scholar]