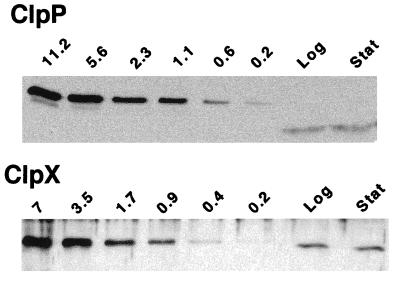
FIG. 8.
Estimation of the number of ClpP and ClpX molecules per cell. Immunoblot analysis was done with anti-ClpP and anti-ClpX sera and with specific amounts (picomoles) of purified His-tagged ClpP and ClpX proteins, respectively, and total proteins from NA1000. The band intensities of total proteins correspond to the amounts of ClpP and ClpX present in 2 × 10⁷ cells and 1 × 10⁸ cells, respectively, during exponential growth (Log) and in 1 × 10⁷ cells and 5 × 10⁷ cells, respectively, during the stationary phase (Stat).

