Fig. 5.
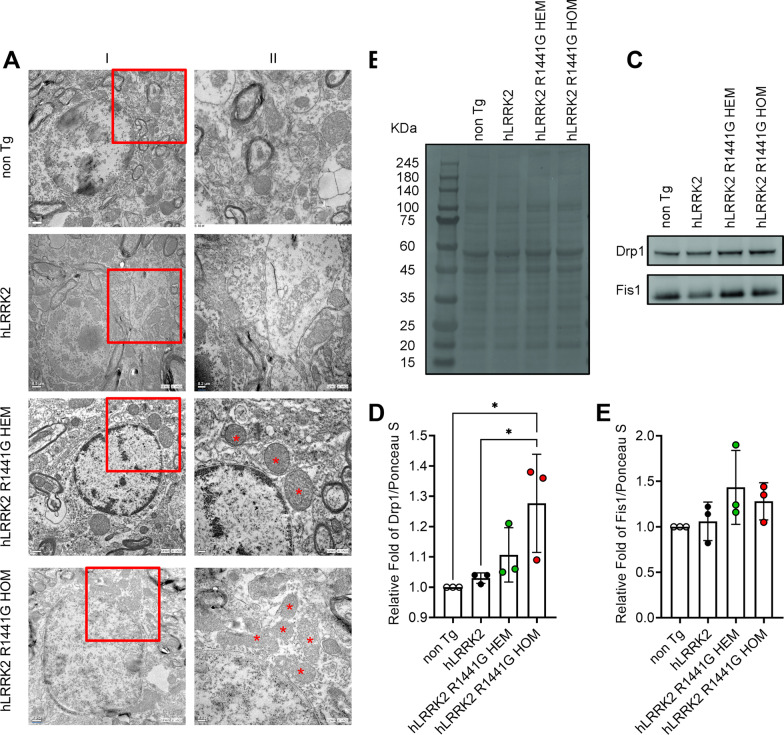
Effect of SN in hLRRK2, R1441G HEM and HOM mice SNc region. A Ultrastructural analysis of SN in hLRRK2, R1441G HEM and HOM mice SNc region. Non-Tg and hLRRK2 represent a healthy mitochondrion; HEM and HOM represent a swollen mitochondrion. Selected regions in different magnification images (I, 10,000×; II, 20,000×). Asterisks indicate shrinkage and matrix condensation. HEM, R1441G HEM; HOM, R1441G HOM. B Western blot analysis of mitochondrial fission proteins in the mitochondrial fraction of the whole brain. Equal loading of the gel is demonstrated with Ponceau S staining for mitochondrial protein fragmentation performed on the blot before immunostaining. B Representative western blot for Drp1 and Fis1 expression. Densitometry of the Drp1 (C) and Fis1 (D) blots is shown as the fold increase (HEM or HOM hLRRK2). The figure shows a representative (of two) experiment. Values are means ± SD. *Significant effect, p < 0.05; **significant effect, p < 0.01; ***significant effect, p < 0.005; ****significant effect, p < 0.001

