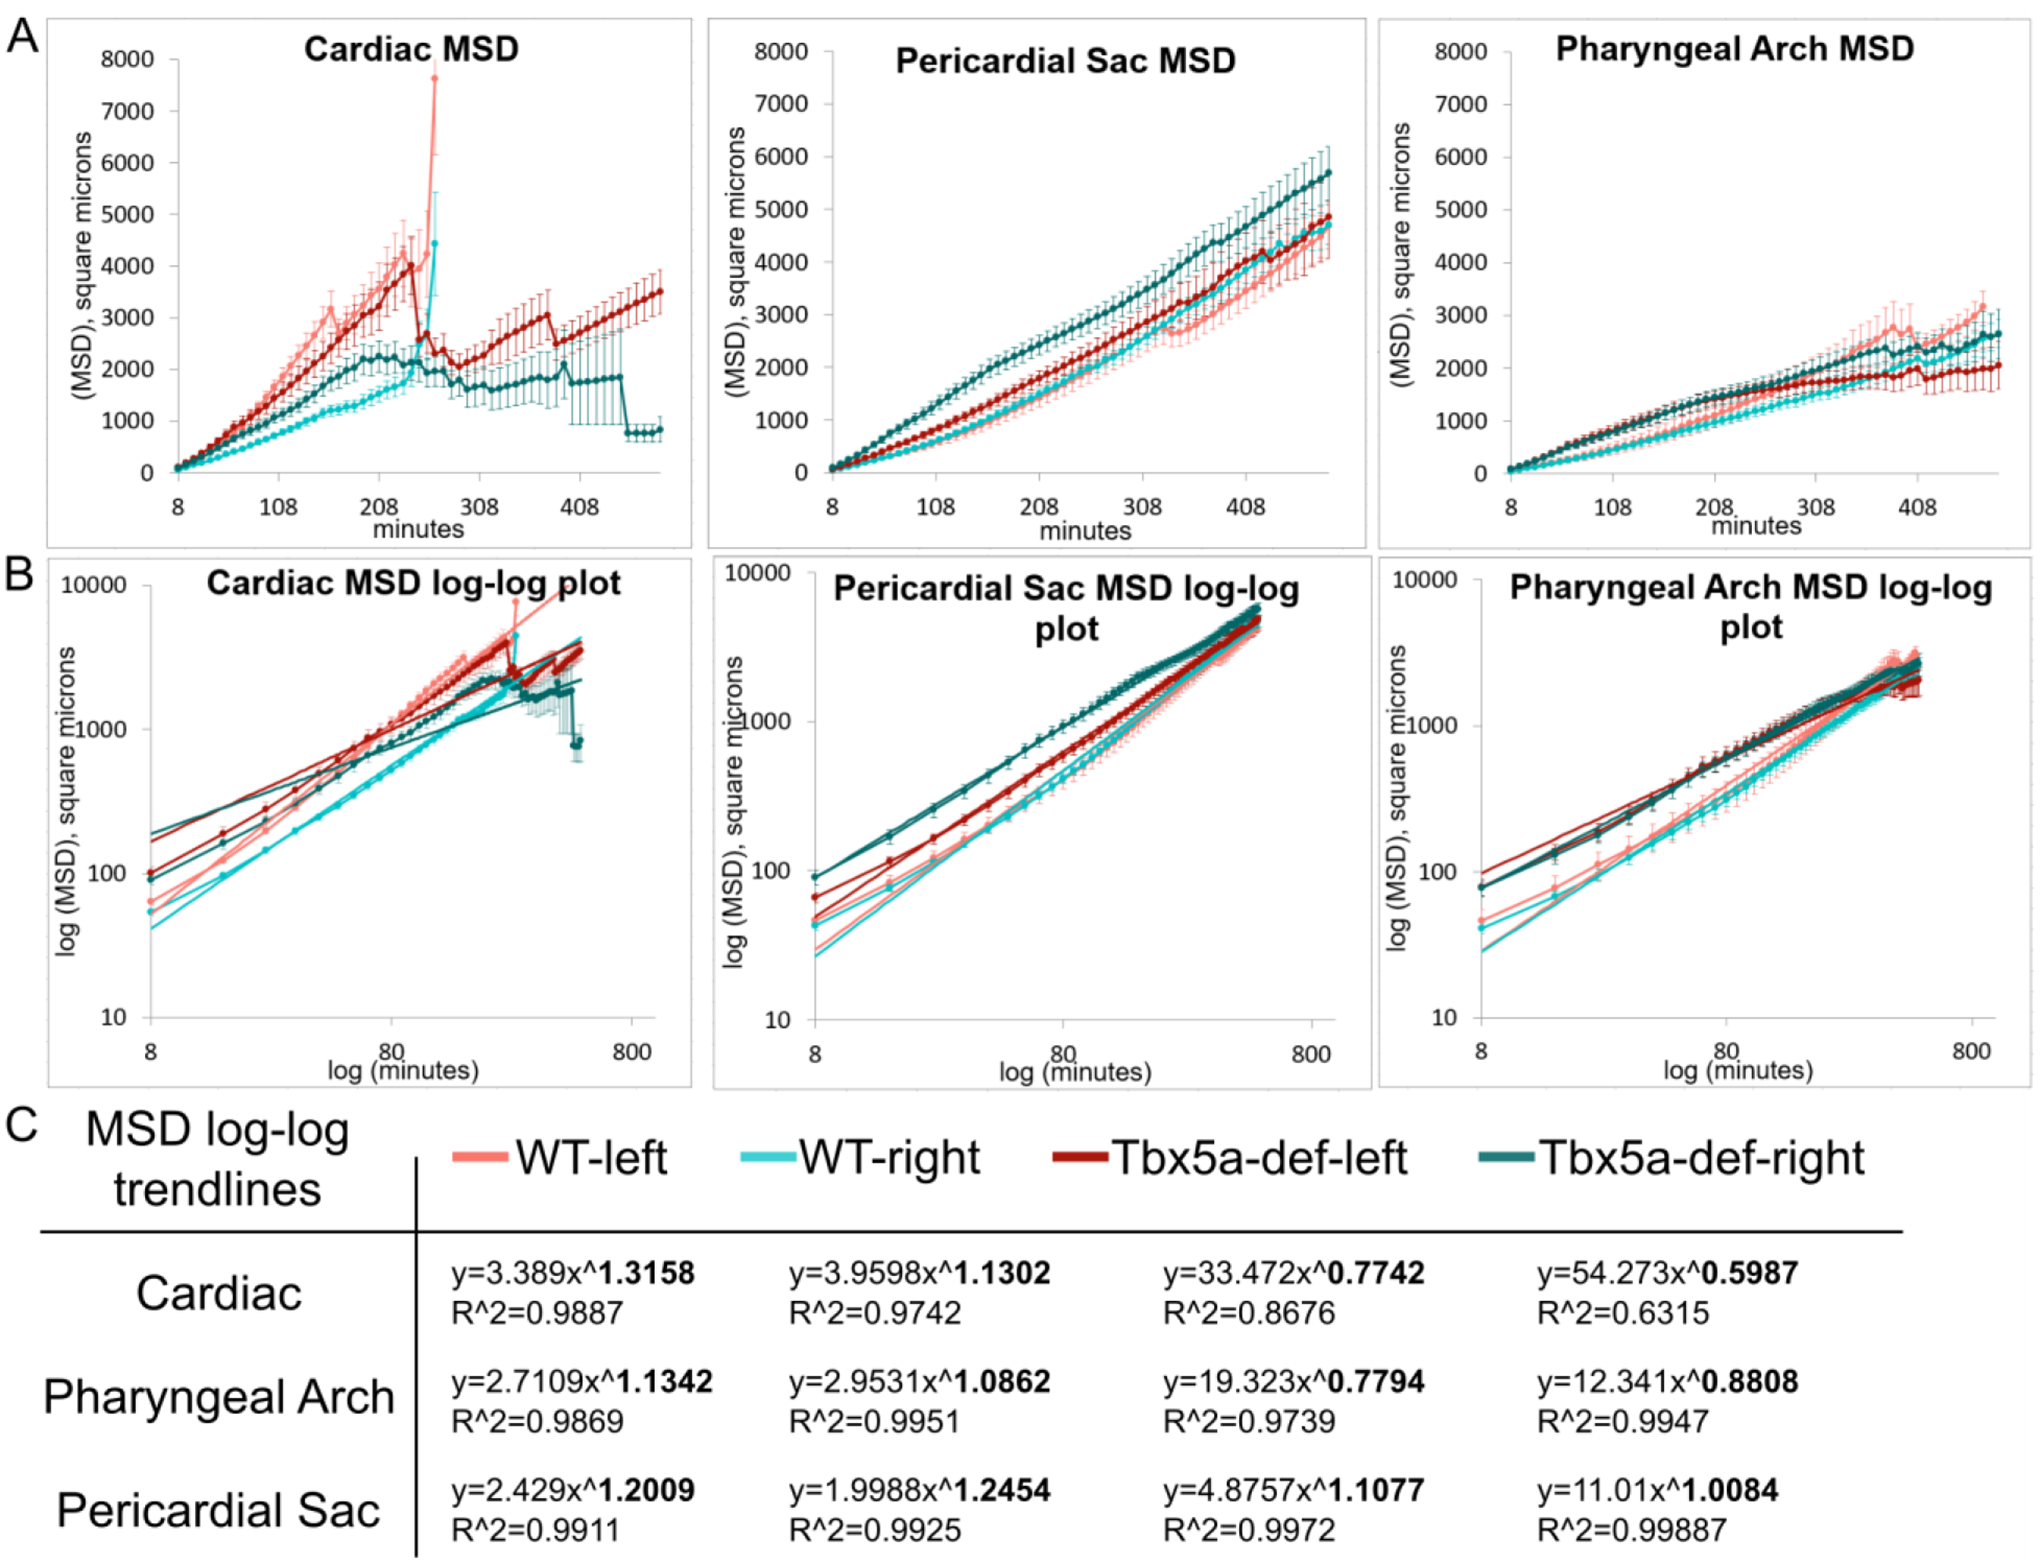
Figure 9-. Derivation of α-value from migration dynamics of lateral aLPM cells.

A- Mean squared displacement (MSD) over time, which was calculated using the DiPer excel macro on cell migration data backtracked in 3D. This measure approximates how much area the cells explore over time. B- log-log plot of MSD over time overlaid with power trendlines. C- Table of power trendlines and correlation coefficients, R^2 value. The α-value is the exponent of the trendline, in bold.
