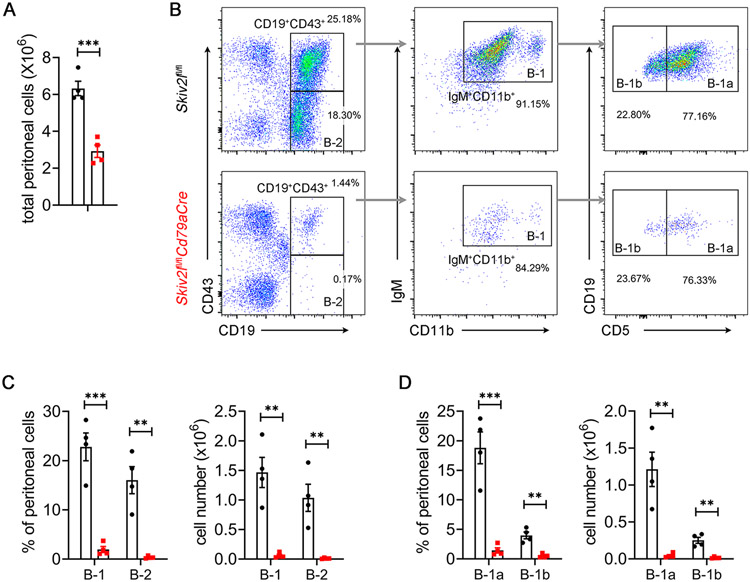
Fig. 3. B-1 B cell deficiency in Skiv2l-deficient mice.
(A) Total peritoneal cell number of Skiv2lfl/flCd79aCre mice and Skiv2lfl/fl littermate controls. n=4 mice per genotype. Data are shown as means ± SEM and are the pool of at least two independent experiments. Unpaired t test, ***P < 0.001.
(B) Flow cytometry analysis of B cell subset of peritoneal cells. Representative plot graph showing gating strategy of B cell subsets.
(C, D) Percentage and absolute numbers of different subsets of B cells in peritoneal cells. n = 4 mice per genotype. Data are shown as means ± SEM and are the pool of at least two independent experiments. Unpaired t test, **P < 0.01; ***P < 0.001.

