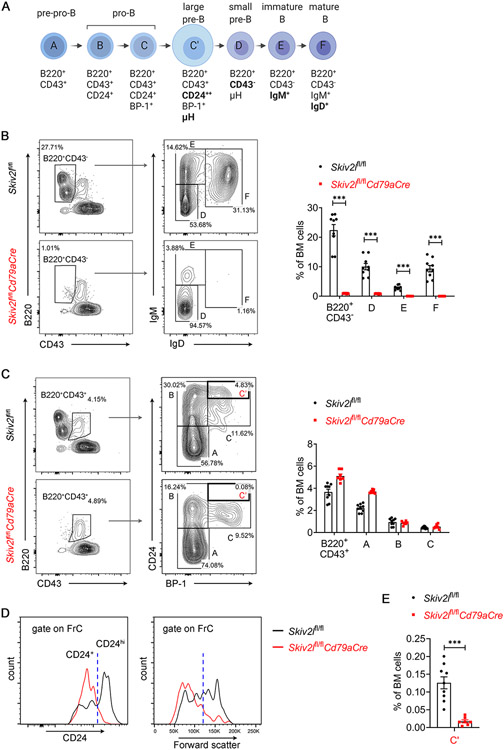
Fig. 4. B cell developmental arrest at pro-B cells in Skiv2l-deficient mice.
(A) Diagram showing developmental stages of early B cells, Hardy fractions (A-F) and cell surface markers of each stage in the bone marrow.
(B, C) Flow cytometry analysis of B cell development in the bone marrow of Skiv2lfl/flCd79aCre mice (n=9) and Skiv2lfl/fl controls (n=7). B220+CD43+ cells were further analyzed for Hardy Fractions A-C (B) and B220+CD43− cells for FrD-F (C). Representative contour plots are shown in the left panel and percentages of each developmental stage in the bone marrow are shown in the right bar graphs. Data are shown as means ± SEM and are the pool of at least three independent experiments. Unpaired t test, ***P < 0.001.
(D) Representative histogram of CD24 expression (left panel) and forward scatter (right panel, indicates cell size) of FrC cells from Skiv2lfl/flCd79aCre mice and Skiv2lfl/fl controls.
(E) Percentages of B220+CD43+CD24hiBP-1+ large pre-B cells (FrC’) in the bone marrow of Skiv2lfl/flCd79aCre mice (n=9) and Skiv2lfl/fl controls (n=7). Data are shown as means ± SEM and are the pool of at least three independent experiments. Unpaired t test, ***P < 0.001.

