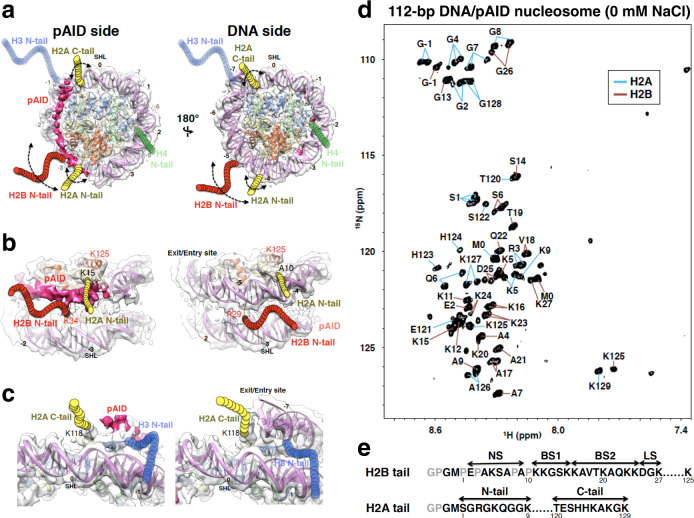
Fig. 1. 2D 1H-15N HSQC spectrum of the H2A and H2B tails in the 112-bp DNA/pAID nucleosome.
a–c Cryo-EM structure of the 112-bp DNA/pAID nucleosome. Six views of the EM density map (EMD-9639) are superimposed on the nucleosome structure (PDB ID: 2CV5) lacking the 33-bp DNA. Visualization of the EM maps and fitting of the nucleosome structures in the maps were performed using UCSF Chimera67. pAID is shown as deep pink density. H2A, H2B, H3, H4, and DNA are colored yellow, red, blue, green, and orchid, respectively. Colored circular chains denote individual histone tails, which are not observed in the EM structure. Superhelix locations (SHL), representing the number of double turns from the dyad axis of the canonical nucleosome (0), are indicated. d Backbone resonance assignments of the 112-bp DNA/pAID nucleosome in the 2D 1H-15N HSQC spectrum recorded in 20 mM HEPES-NaOH, pH 7.0, 10% D2O on a 950-MHz spectrometer. Blue and orange lines indicate residues of H2A and H2B, respectively. e Amino acid sequences of the H2A and H2B tails. Assigned and unassigned residues in NMR are colored black and gray, respectively.

