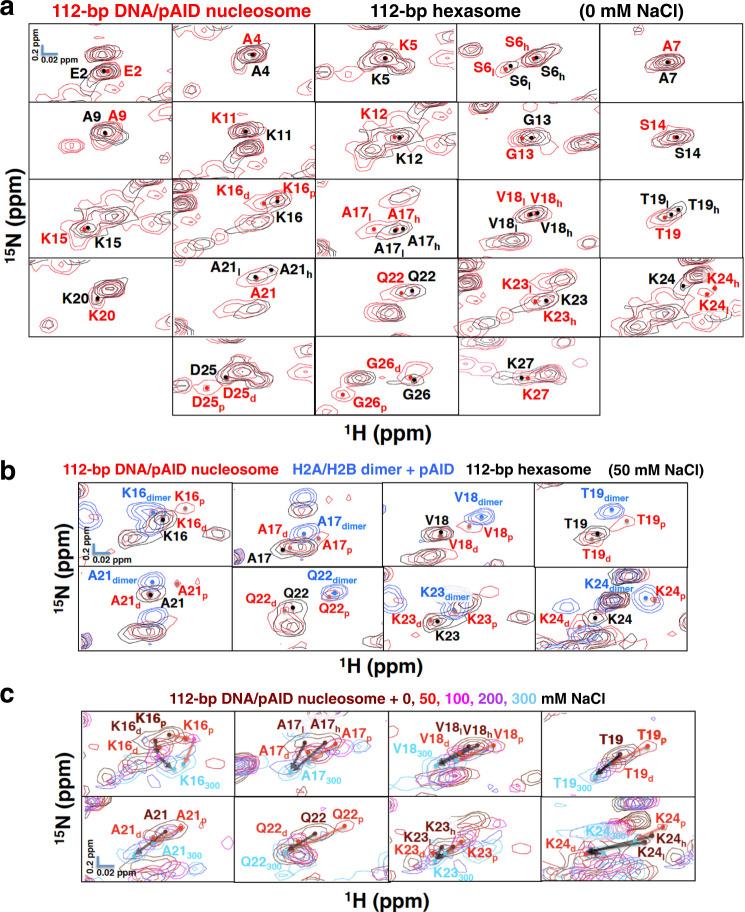
Fig. 3. Establishment of the pAID and DNA sides of the H2B N-tail in the 112-bp DNA/pAID nucleosome.
a Comparison of extended HSQC spectra of the H2B N-tail between the 112-bp DNA/pAID nucleosome (red) and the 112-bp hexasome (black) at 0 mM NaCl. NMR signals are divided into panels by amino acid residue of H2B. Signal assignments in the 112-bp DNA/pAID nucleosome and 112-bp hexasome at 0 mM NaCl are labeled in red and black, respectively. Filled circles indicate each signal center. pAID and DNA side signals are designated by subscript p and d, respectively. High- and low-field components of the signals are designated by subscript h and l, respectively. b Expanded signal comparison of the H2B BS2 region among the 112-bp DNA/pAID nucleosome (red), 112-bp hexasome (black), and H2A/H2B dimer upon the addition of an equivalent amount of pAID (light blue) at 50 mM NaCl. Residues corresponding to signals of the H2A/H2B dimer upon the addition of pAID are designated by the subscript “dimer”. c Ionic strength dependence of selected signals of the H2B BS2 region in the 112-bp DNA/pAID nucleosome upon NaCl titration at 0 M (brown), 50 mM (red), 100 mM (pink), 200 mM (purple), and 300 mM (cyan). NMR signals are divided into panels by amino acid residue. Residues are labeled in the color corresponding to the NaCl condition. Residues of the signal at 300 mM NaCl are designated by subscript 300. Red and black arrows indicate the chemical shift changes of the pAID and DNA side signals, respectively, between 0 or 50 mM and 300 mM NaCl.

