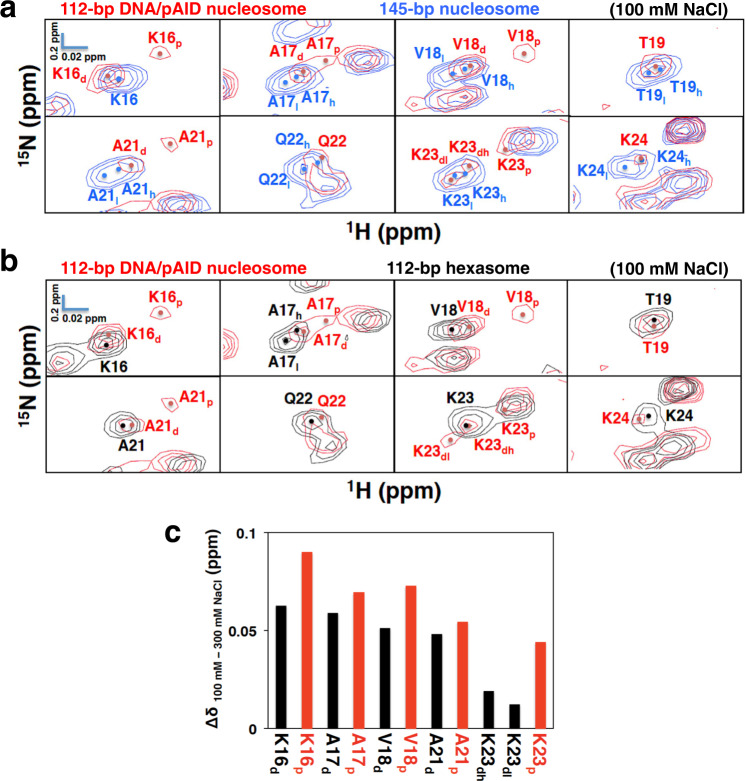
Fig. 5. Conformational comparison of the H2B BS2 region under the physiological salt condition.
a, b Expanded signal comparison between the 112-bp DNA/pAID nucleosome (red) and the 145-bp nucleosome (blue) (a) or the 112-bp hexasome (black) (b) at 100 mM NaCl. NMR signals are divided into panels by amino acid residue (Lys16–Thr19 and Ala21–Lsy24 of H2B). Signal assignments in the 112-bp DNA/pAID nucleosome, 145-bp nucleosome, and 112-bp hexasome are labeled in red, blue, and black, respectively. Filled circles indicate each signal center. pAID and DNA side signals are designated by subscript p and d, respectively. High- and low-field components of the signals are designated by subscript h and l, respectively. c Histogram showing chemical shift differences between 100 mM and 300 mM NaCl of the pAID and DNA side signals in the H2B BS2 region of the 112-bp DNA/ pAID nucleosome. Chemical shift differences are plotted for pAID side (red) and DNA side (black) residues in the H2B BS2 region.

