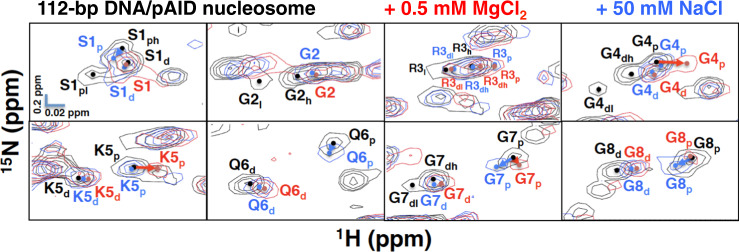
Fig. 7. Conformational comparison of the H2A N-tail upon metal ion titration.
Expanded signal comparison of the H2A N-tail in the 112-bp DNA/pAID nucleosome at 0 M (black), 0.5 mM MgCl2 (red), and 50 mM NaCl (blue). NMR signals are divided into panels by each amino acid residue, Ser1–Gly8 of H2A. Signal assignments in the 112-bp DNA/pAID nucleosome at 0 M, 0.5 mM MgCl2, and 50 mM NaCl are labeled in black, red, and blue, respectively. Filled circles indicate each signal center. pAID and DNA side signals are designated by subscript p and d, respectively. High- and low-field components of the signals are designated by subscript h and l, respectively. Arrows indicate chemical shift changes of pAID side signals between 0 mM and 0.5 mM MgCl2 (red) or 50 mM NaCl (blue).

