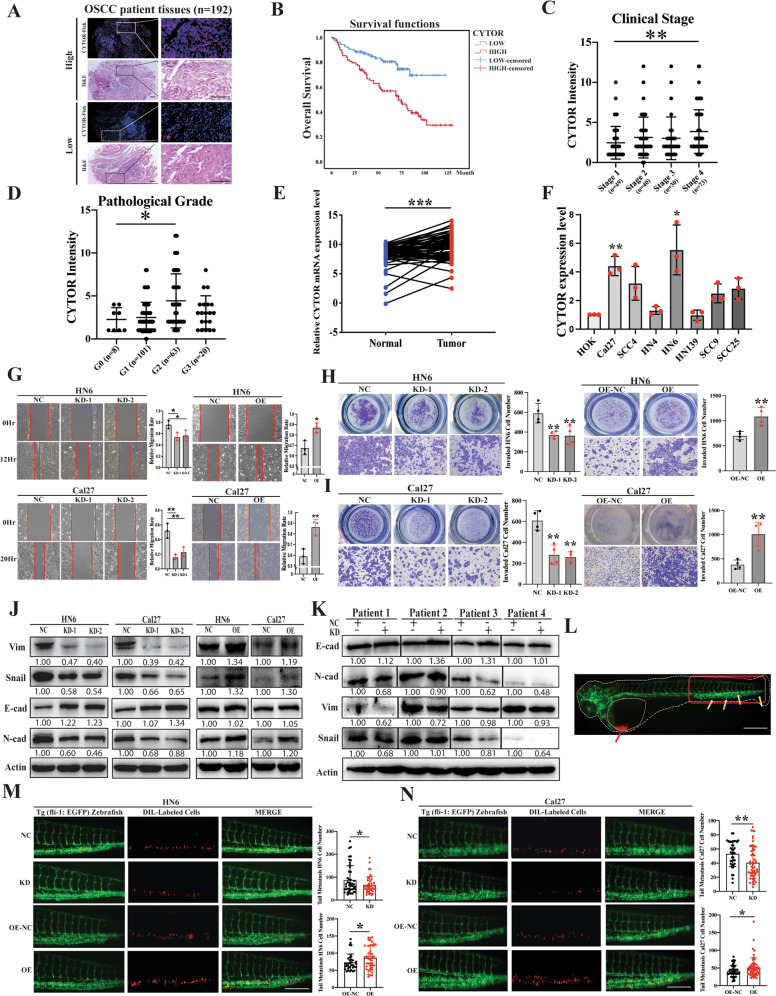
Fig. 1. Elevated expression of CYTOR promotes EMT-mediated migration and invasion in OSCC.
A Total 192 sampled OSCC patient tissues were subjected to tissue microarray for FISH assay. B The survival analyses of the CYTOR-low and CYTOR-high expression OSCC patients were performed using the Kaplan–Meier method and assessed using the log-rank test. C CYTOR expression in OSCC patients with different clinical stages and D pathology grades. E qPCR detection showed the CYTOR was highly expressed in OSCC tissue (n = 63) compared with the expression in adjacent normal oral epithelium tissue (n = 63), statistical analysis was performed by paired t-test. F Determination of CYTOR mRNA expression in OSCC and normal cell lines. Median values are plotted in the column with data generated from three technical replicates (each dot indicates the average of at least three biological replicates), statistical analysis was performed by one-way anova followed by multiple t-tests. G Wound healing assays were used to evaluate the expression of CYTOR in regulating the migration behavior of HN6 and Cal27 cell lines. H, I Transwell invasion assays in CYTOR-knockdown cells and CYTOR-overexpressing cells. Median values are plotted in the column with data generated from four technical replicates (each dot represents the average of three biological replicates), statistical analysis was performed by one-way anova followed by multiple t-tests. J Western blot assays detected the vimentin, snail, e-cad, n-cad and beta-actin proteins in CYTOR knockdown or overexpression cells. K Western blot assays for EMT-related proteins in si-CYTOR transfected PDCs. L OSCC cell lines were microinjected into the perivitelline space of zebrafish to evaluate the invasion ability of the cells. Red arrow indicates the injection area of dil-labeled OSCC cells, the red box indicates the monitor region of cell invasion, yellow arrows indicate the metastasized cells. M, N Zebrafish xenografts revealed that the knockdown of CYTOR inhibited the cells invasion ability, whereas the overexpression of CYTOR promoted the invasion ability of oral cancer cell lines. Median values are plotted in the column, statistical analysis was performed by unpaired t-tests. (KD knockdown, NC negative control, OE overexpression; scale bars, 400 μm. The data was presented as mean ± SD, *P < 0.05, **P < 0.01, and ***P < 0.001).

