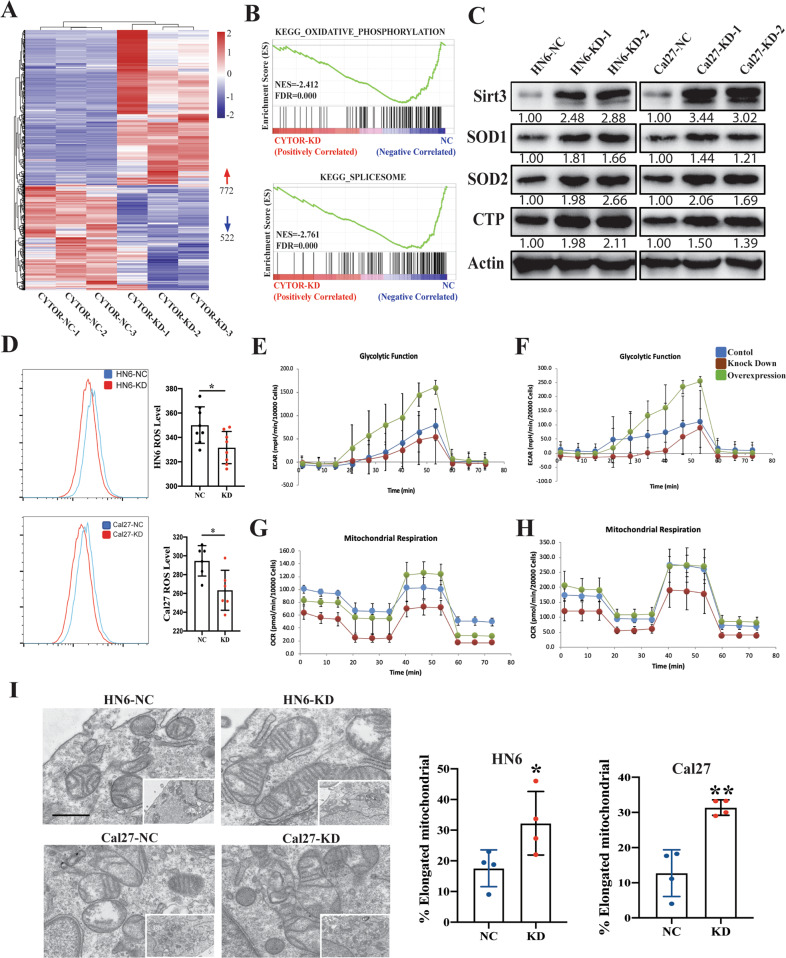
Fig. 2. CYTOR regulates the glycolysis and mitochondrial respiration function in oral cancer cells.
A RNA-seq analysis showing that CYTOR expression is associated with 1294 genes dysregulation in Cal27 cells. B Gene set enrichment analysis (GSEA) of the CYTOR-related pathways in CYTOR-knockdown Cal27 cells. C Western blot analysis showing the mitochondrial-related proteins (SIRT3, CTP, SOD1, SOD2) expression in CYTOR-depletion cells. D Flow cytometry analysis of ROS level (MitoSOX) in HN6 and Cal27 cells. E, F CYTOR-knockdown and CYTOR-overexpression HN6 and Cal27 cells were detected for ECAR to indicate the glycolysis stress. Median values are plotted in the column with data generated from six technical replicates and three biological replicates (each dot indicates the mean value of three independent biological replicates), statistical analysis was performed by unpaired t-tests. G, H CYTOR-knockdown and CYTOR-overexpression HN6 and Cal27 cells were detected for OCR to indicate the mitochondrial respiration. I Transmission electron microscope exposing the ultrastructure of mitochondrial in HN6 and Cal27 cells. Median values are plotted in the dots plot with data generated from four independent biological replicates, statistical analysis was performed by unpaired t-tests (KD knockdown, NC negative control; scale bar = 1 μm. The data was presented as mean ± SD, *P < 0.05).

