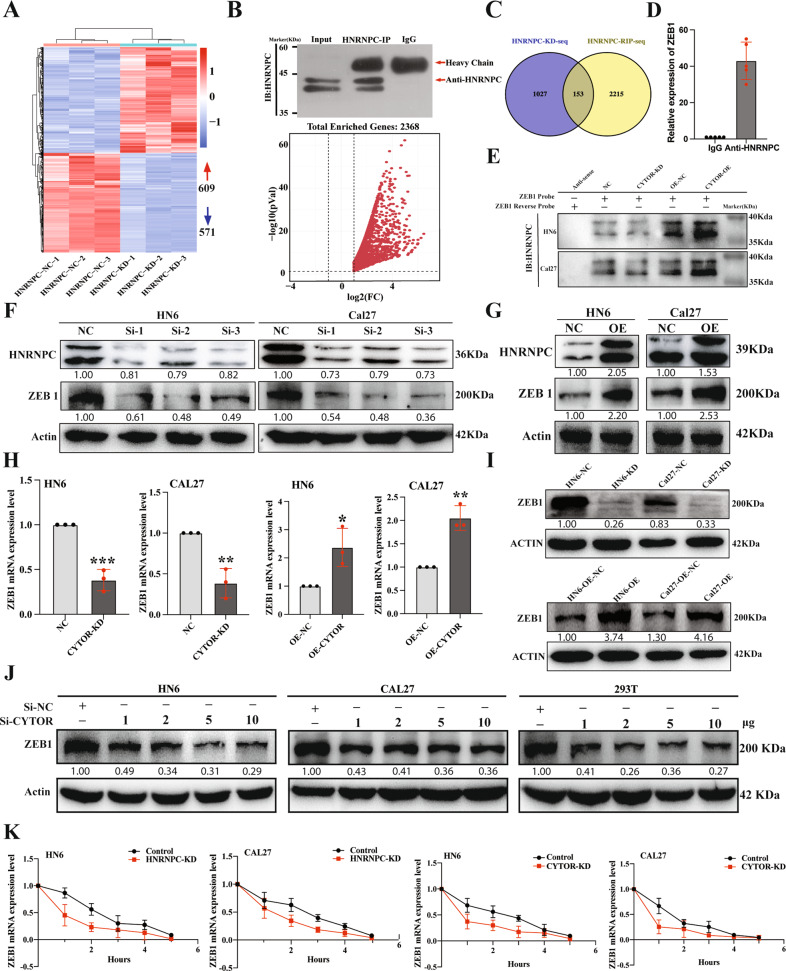
Fig. 4. HNRNPC enhances CYTOR-mediated mRNA stability of ZEB1.
A RNA-seq analysis showing that HNRNPC expression is associated with 1180 genes dysregulation in Cal27 cells. B RIP-seq assay demonstrated that 2368 protein-coding genes possibly interact with HNRNPC; Upper panel: IP result of anti-HNRNPC antibody; Lower panel: Volcano plot showed 2368 protein-coding genes significantly enriched in the precipitates obtained by an anti-HNRNPC antibody. C Venn diagram showed 153 genes in both RNA-seq and RIP-seq analysis. D RIP assays were performed using antibody against HNRNPC and normal rabbit IgG to verify the interactions of ZEB1 and HNRNPC. Median values are plotted in the column with data generated from five technical replicates, each dot indicates the average of the three independent biological replicates. E The protein extracts of CYTOR-knockdown and CYTOR-overexpression cell lines were incubated with the biotin labeled-sense and anti-sense of ZEB1 for pull-down assays then immunoblotted for HNRNPC. F HN6 and Cal27 cells were transfected with small interferon RNA of HNRNPC and subjected to WB to evaluate the protein expression of ZEB1 and HNRNPC. G Cells were transfected with pcDNA-HNRNPC and pcDNA-NC to evaluate the effect of HNRNPC in regulating the ZEB1 expression. H qPCR analysis for ZEB1 expression in CYTOR-knockdown and CYTOR-overexpression cell lines. Median values are plotted in the column with data generated from three technical replicates, each dot represents the average gene expression level from at least three biological replicates. Statistical analysis was performed by unpaired t-tests. I Immunoblotting for ZEB1 expression in CYTOR-knockdown and CYTOR-overexpression cell lines. J HN6, Cal27 and 293 T cells were transfected with the different doses of si-RNAs to knockdown the CYTOR expression, then the expression of ZEB1 was analysis by WB. K Cells were treated with actinomycin D for the indicated time, then mRNA expressions of ZEB1 were measured by qPCR. (Linear mixed effect regression models with time point defined as random intercept and group defined as random slope were used to test the difference between two groups, median values are plotted in the plots with data generated from three technical replicates and three biological replicates). (P < 0.05).

