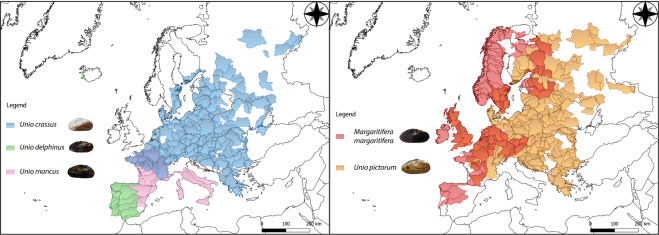
Fig. 1.
Maps of the five species’ potential distributions produced by overlapping points of recent presence records (obtained from Lopes-Lima et al.10) with the Hydrobasin level 5 polygons59. Overlapping distribution polygons between Unio mancus and Unio crassus are represented by a light purple shade, in the left panel. Overlapping distribution polygons between Unio pictorum and Margaritifera margaritifera are represented by an orange shade, in the right panel.

