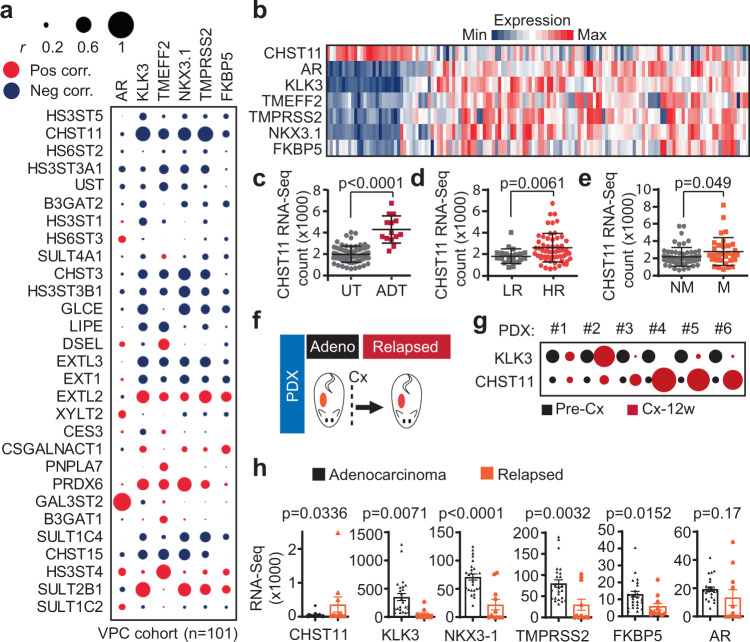
Fig. 2. Patient tumors with loss of AR activity display elevated CHST11 and chondroitin sulfate levels.
a Correlation analysis of mRNA levels of GAGs biosynthesis genes identified in Fig. 1c and AR regulated genes (KLK3, TMEFF2, NKX3.1, TMPRSS2, FKBP5). Circle size represents Pearson correlation coefficient absolute values. Blue, negative correlation; Red, positive correlation, VPC cohort (n = 101)39. b Heatmap of gene expression in CRPC patients; (UW cohort; n = 138) [https://www.ncbi.nlm.nih.gov/geo/query/acc.cgi?acc=GSE147250] (GSE147250). c CHST11 gene expression in untreated (n = 69) and ADT treated PC patients (n = 14) (mean ± SD; two-tailed Mann-Whitney test); d low-risk (LR, n = 22) and high-risk (HR, n = 57) (mean ± SD; two-tailed Mann-Whitney test); e patients with metastases (M; n = 33) and without metastases (NM; n = 58) (mean ± SD; two-tailed Mann-Whitney test). (VPC cohort). f Schematic protocol of PDXs tumor generation for RNA-Seq analysis used in g and h. g CHST11 and KLK3 gene expression in prostate cancer (PC) PDXs before (Pre-Cx) and 12 weeks after castration (Cx-12w). Circle size represents fold change of normalized RNA-Seq counts of Cx-12w compared to Pre-Cx in each PDX. h RNA-Seq gene expression of CHST11 and AR regulated genes in Adeno (n = 26) and relapsed (n = 11) PC PDXs. (mean ± SEM; two-tailed t-test). Source data are provided as a Source Data file.

