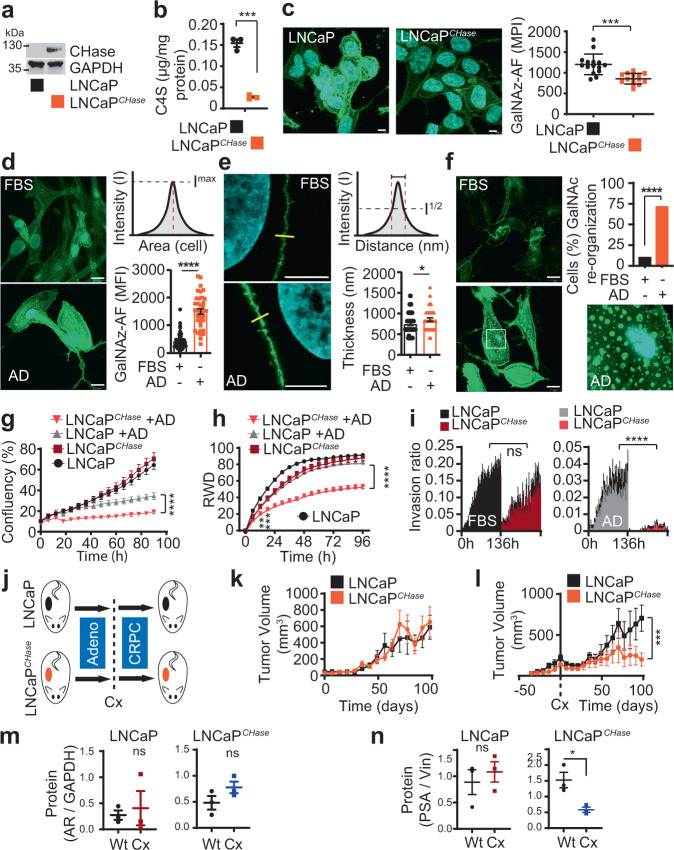
Fig. 5. Prostate cancer becomes dependent on high chondroitin sulfate levels after ARPI.
a Expression of CHase in LNCaPCHase and parental cell lines by western blotting. b C4S quantification in LNCaP and LNCaPCHase cell lines using LC-MS. C4S content normalized to protein content and shown as mean ± SEM; n = 3 independent samples; p = 0.0002 by two-tailed t test. c CS quantification using Gal-NAz incorporation followed by Cu click of alkyne-488 on LNCaP and LNCaPCHase cells; data shown as mean of maximum pixel intensity (MPI) ± SD. n = 15 fields of view; p < 0.0001 by two-tailed t test. d Levels of GalNAc in LNCaP cells glycocalyx determined in AD and normal conditions (FBS) by immunofluorescence using GalNAz followed by Cu click of alkyne-488 (green). DAPI staining (blue) was used to identify the nucleus. Scale bar is 10 μm. Data are shown as mean ± SEM; p < 0.0001 by two-tailed t test. (FBS, n = 45 ROI; AD, n = 35 ROI). e Thickness of GalNAc positive cell membranes. Data are shown as mean ± SEM; (FBS n = 48; AD n = 39); p = 0.046 by two tailed t test. f Glycocalyx re-organization in AD condition. Data are expressed as percentage of cells with GalNAz spots at cell basement (n = 11 fields of view); p < 0.0001 by Chi-squared test. g Growth (IncuCyte) of LNCaP and LNCaPCHase cells in FBS or AD conditions at different time points. Data are shown as mean ± SD; FBS n = 16; AD, n = 6 independent samples; p < 0.0001 after 24 h; 2 two-way ANOVA followed by Tukey’s correction. h Relative wound density (RWD) measurements of LNCaP and LNCaPCHase cells in FBS or AD conditions. Data are shown as mean ± SD; n = 4 independent samples; p < 0.0001 after 24 h; 2 two-way ANOVA followed by Tukey’s correction. i Invasion capacity (IncuCyte; Chemotaxis assay) of LNCaPCHase and parental cell lines in FBS and AD conditions for 136 h. The recipient well-contained media + 10% FBS as chemoattractant. Results are expressed as phase object count normalized to initial Top value (bottom) and shown as mean ± SEM. n = 4 independent samples; p < 0.0001 after 24 h; 2 two-way ANOVA followed by Tukey’s correction. j Protocol schematic of LNCaP and LNCaPCHase xenografts growth in ambient and castration conditions. k Tumor growth of LNCaP and LNCaPCHase xenograft without or l after castration. Data are shown as mean of tumor size ± SEM; n = 5 animals; p = 0.031 by Mann-Whitney test on slopes after castration from nadir to endpoint. m Western blot intensity quantification of AR levels from tumors in Figs. 5k and 5l; data represents AR to GAPDH intensity ratio and shown as mean ± SEM; n = 3 biologically independent tumor samples. n Western blot intensity quantification of PSA levels from tumors in Fig. 5k and l; data represent PSA to vinculin intensity ratio and shown as mean ± SEM; n = 3 biologically independent tumor samples; p = 0.022 by two tailed t test. ns: non-significant, *p < 0.05; **p < 0.01; ***P < 0.001; ****P < 0.0001. Source data are provided as a Source Data file.

