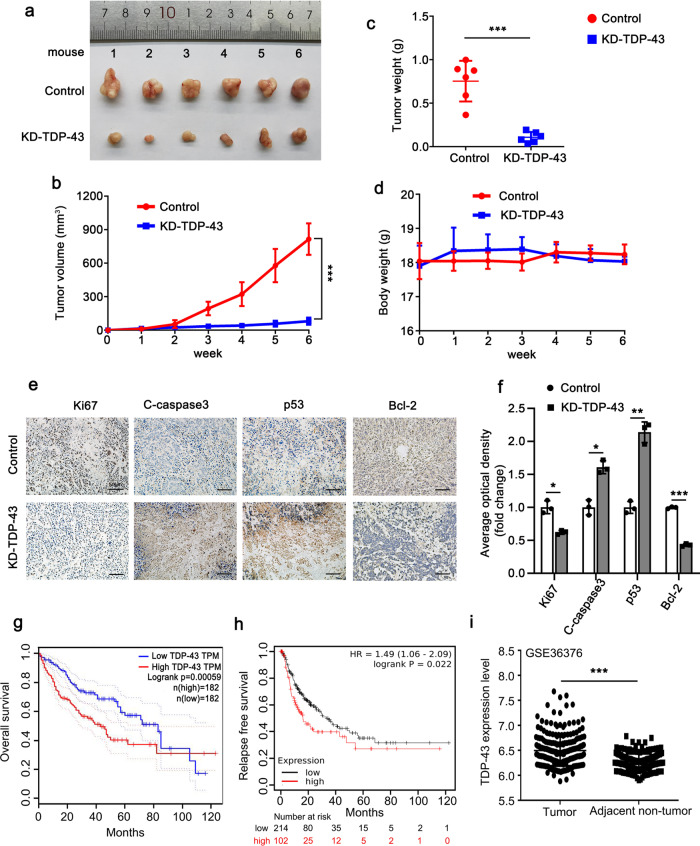
Fig. 2. TDP-43 accelerates growth and inhibits apoptosis in liver tumor.
Tumor images (a), tumor growth curves (b), and tumor weights (c) of the xenograft tumors derived from MHCC97H-KD-TDP-43 and MHCC97H-Control cells (n = 6). d The body weights of mice in the indicated groups. IHC staining of Ki67, C-caspase3, p53, and Bcl-2 in mice xenograft tumors (e) and quantitative analysis (f). Scale bar: 50 µm. g, h Overall survival and relapse-free survival were analyzed in HCC cancer patients using the GEPIA (http://gepia.cancer-pku.cn/) and Kaplan–Meier plotter (http://kmplot.com/analysis/) online databases, respectively. Plots were generated based on the expression level of TDP-43 (g plot: logrank P = 0.00059; h plot: logrank P = 0.022). i The expression levels of TDP-43 in liver tumor tissues and normal tissues adjacent to the tumor were counted from GEO database GSE36376. Error bars represent ± s. d. *P < 0.05, **P < 0.01, ***P < 0.001 by two-tailed Student’s t test.

