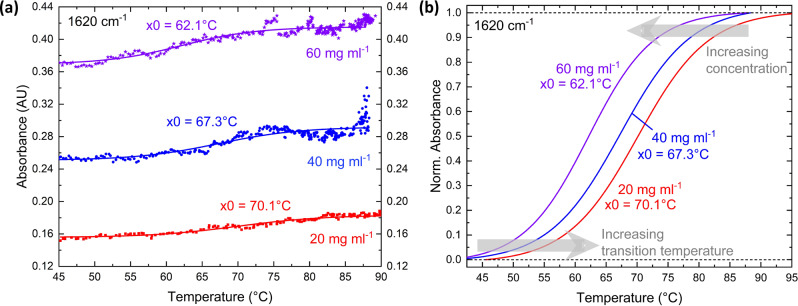
Fig. 6. Denaturation measurement results at 1620 cm−1.
Investigation of three different concentrations of BSA: 20 (red), 40 (blue), and 60 mg ml−1 (violet) and extraction of the transition temperature x0. a Absolute measurement values (circles) and sigmoidal Boltzmann-Fit curves (solid lines) in absorbance units (AU). b Comparison of the (individually normalized) Boltzmann-fit curves, showing the temperature- and concentration-dependence of the sigmoidal-shaped absorbance curves.

