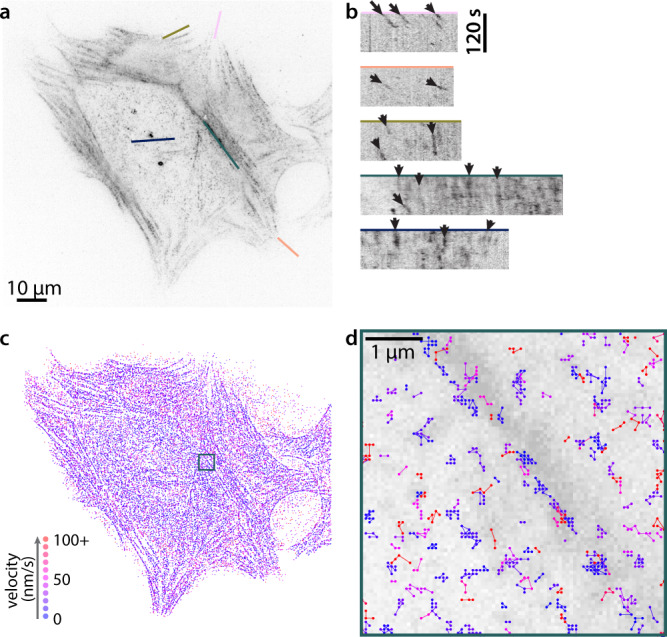
Fig. 1. SiR-Actin labeling reveals variation in F-actin velocities in fibroblasts.

a An HFF labeled with 50 nM SiR-Actin. This labeling strategy was successfully repeated in live HFFs (5 experimental replicates), though SiR-Actin concentration was varied to achieve similar labeling densities (see Methods, Experimental Setup and Imaging). b Kymographs showing actin motion in the cell in a over 120 s, at the cell edge (pink and peach), closer to the cell body (olive), and in stress fibers (teal and blue). c Single particle tracking for the same cell over the same 120 s interval. The first point of each track is shown, color-coded by its apparent velocity. d Close up of the boxed region in c, showing all points of the tracks in and surrounding a stress fiber. The tracks are overlaid over the mean intensity projection of the time series. Scale bar is 1 μm.
