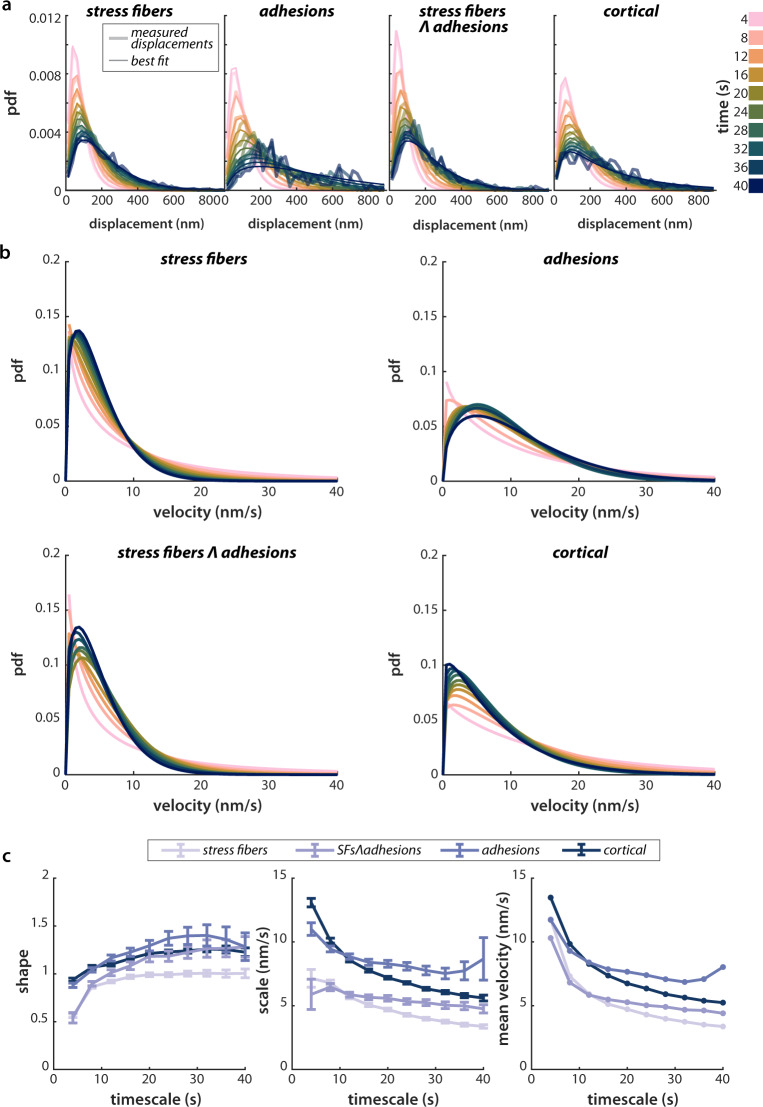
Fig. 3. Inferred distributions of F-actin velocities show distinct behavior inside vs. outside SFs.
a Puncta were automatically classified into subpopulations, corresponding to the four mutually-exclusive combinations of (±) stress fibers and (±) adhesions: the cortical population is taken to be F-actin outside both stress fibers and adhesions. Displacements for each subpopulation, along with best fits, are shown for varying time intervals. The distribution of displacements is calculated for timescales ranging from 2 s to 40 s, in 2 s intervals. Only every other time interval is shown for clarity. b The inferred velocity distributions corresponding to the measured distance distributions in a, assuming that underlying displacements follow a Weibull distribution. Example data and fits in a, b are for representative from one experiment, n = 9 cells. c Left, center: Fit parameters for the Weibull distribution fits. Error bars show the 95% confidence interval for each parameter, determined by normal approximation (see Methods, Model Fitting). Right: the average velocity for each population and timescale, calculated from the best-fit Weibull distribution. The best fit parameters in (c) represent the average over four experimental replicates, comprising 32 cells in total. Source data for all plots are provided in the Source Data file.

