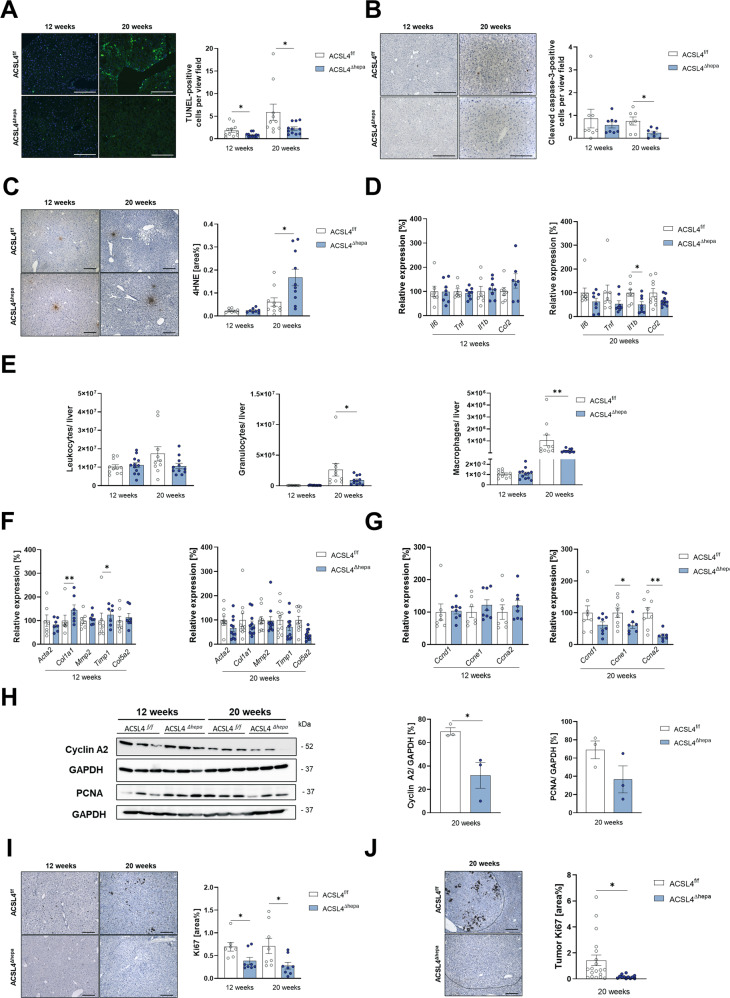
Fig. 3. Acsl4 deficiency in hepatocytes alters cell death, inflammation, and proliferation in STZ-HFD model.
TUNEL staining (A), cleaved caspase-3 staining (B), and 4-hydroxynonenal (4HNE) staining (C) of liver sections from Acsl4f/f and Acsl4∆hepa mice after 12 and 20 weeks of STZ-HFD treatment (n ≥ 7). Scale bars: 200 µm (A, B) or 100 µm (C). Quantification of TUNEL-positive cells (A), cleaved caspase-3-positive cells (B), and 4HNE-positive area (C) per view field. D Gene expression of inflammation markers (Il6, Tnf, Il1b, and Ccl2) was determined by qRT-PCR in livers and presented as relative expression compared to Acsl4f/f mice. E Infiltrating leukocytes were isolated from livers. Cells were stained for CD45 to identify leukocytes and with Hoechst 33258 to exclude dead cells. Cells were stained for suitable markers and gated as neutrophil granulocytes (CD11b+ Ly6G+) or macrophages (CD11b+ F4/80+). Gene expression of fibrosis markers (Acta2, Col1a1, Mmp2, Timp1, and Col5a2) (F) and proliferation markers (Ccnd1, Ccne1, and Ccna2) (G) was determined by qRT-PCR in livers and presented as relative expression compared to Acsl4f/f mice. H Immunoblot analysis of liver extracts for proliferation-related proteins (cyclin A2 and PCNA), using GAPDH as loading control. Quantification of protein levels, normalized to GAPDH. I Ki67 staining of liver sections (n ≥ 7). Scale bars: 100 µm. Quantification of Ki67-positive area was performed using ImageJ. J Ki67 staining of tumor areas in livers from Acsl4f/f and Acsl4∆hepa mice after 20 weeks of treatment (n ≥ 5). Quantification of Ki67-positive area within tumor areas was performed using ImageJ. Data are expressed as mean ± SEM from 10 to 12 mice per group (unless stated otherwise). *p < 0.05; **p < 0.01; ***p < 0.001; unpaired t-test comparing Acsl4∆hepa to Acsl4f/f mice for each time point.

