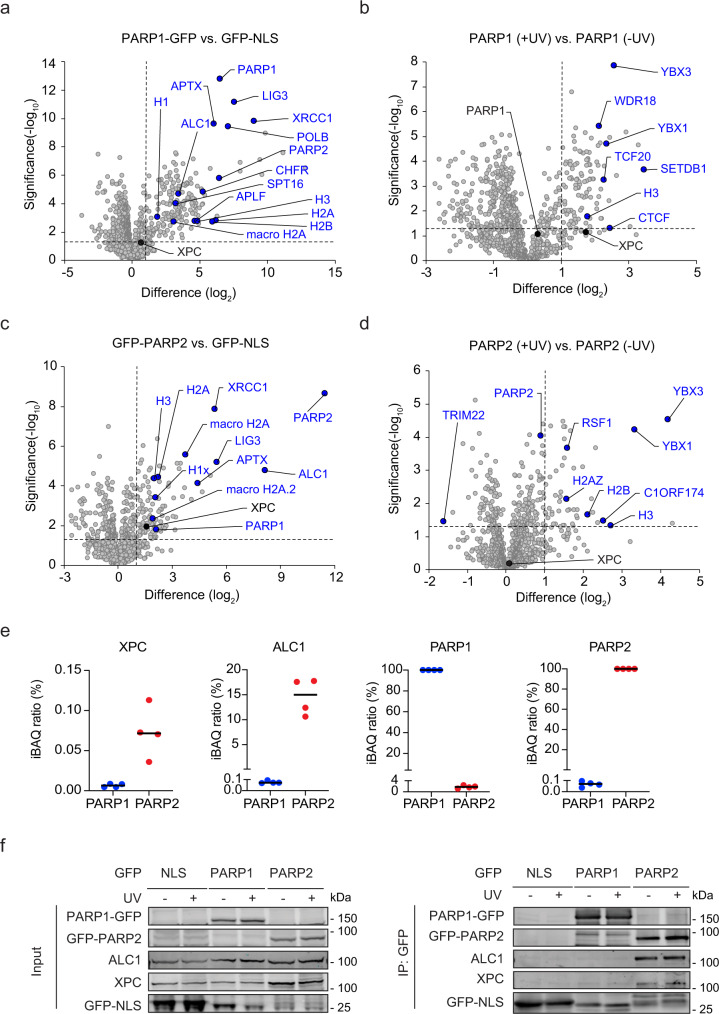
Fig. 2. XPC and ALC1 interact more strongly with PARP2 than PARP1.
a, c Volcano plots displaying the interactomes of a PARP1-GFP and c GFP-PARP2 after GFP-pull-down from U2OS (FRT) WT cells and analysis by label-free proteomics. b, d Differential interactomes of b PARP1-GFP and d GFP-PARP2 from UV-C-irradiated (20 J/m2, 1 h) vs. unirradiated U2OS (FRT) WT cells. a–d The dashed lines indicate a twofold enrichment on the x axis (log2 of 1) and a significance of 0.05 (−log10 P value of 1.3; two-sided t test) on the y axis. e Enrichment of XPC, ALC1, PARP1, and PARP2 in the co-IPs of PARP1 (a) and PARP2 (b), calculated by intensity-based quantification (IBAQ). Each data point represents a biological replicate (n = 4). f Co-IP of GFP-NLS, PARP1-GFP, and GFP-PARP2 in the presence and absence of UV-C (20 J/m2, 1 h). Three independent replicates of each IP experiment were performed obtaining similar results.

