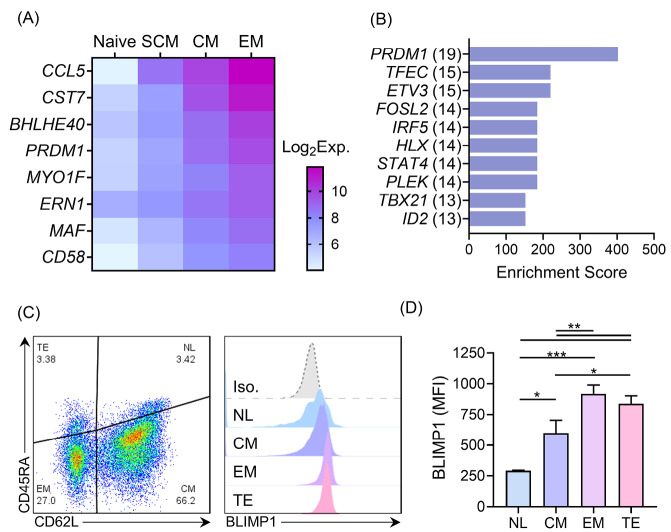
Fig. 1.
Global gene expression and BLIMP1 protein expression in different human T cell memory phenotypes. A) Gene expression of eight genes on a significantly meaningful (adj. P > 0.05) graded scale of increase were expressed in different phenotypes, from N to EM T cells. B) The top ten transcription factors with enriched targets among the EM T cell-upregulated genes, based on the ARCHS 4 TF co-expression database. The number of detected targets for each TF is shown in parentheses. C) The scatter plot (left) shows a representative data of memory phenotypes of CD3+ T cells in unstimulated human PBMCs detected based on CD62L and CD45RA expressions. Stacked histograms (right) show BLIMP1 MFI, which is gated on different memory phenotypes. D) The summary quantitative data of BLIMP1 MFI across different memory phenotypes of human T cells. The data are presented as mean ± SD, *P < 0.05, **P < 0.01, and ***P < 0.001, n = 9 in transcriptome data, n = 4 in BLIMP1 staining. BLIMP1: B lymphocyte-induced maturation protein 1; MFI: Median fluorescent intensity; N: Naïve; EM T cell: Effector memory T cell; PBMC: Peripheral blood mononuclear cells.

