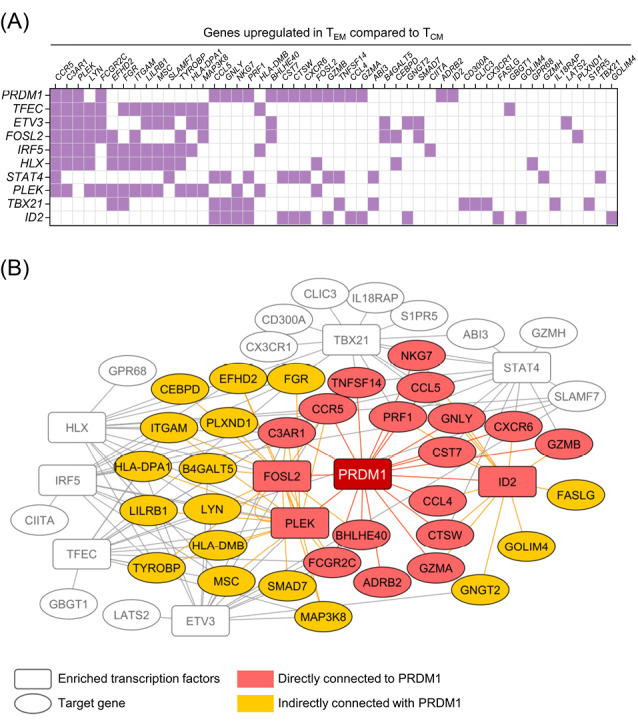
Fig. 2.

Transcription factor enrichment analysis on a list of genes upregulated in EM T cells compared to CM T cells. A) Heatmap representation of the overlap of the list of top ten enriched transcription factors (vertical axis) and corresponding EM T cell upregulated genes (horizontal axis). Some of the enriched transcription factors, FOSL2, PLEK and ID2, are also present in the EM T cell upregulated gene list. B) A network model built based on top ten enriched transcription factors illustrates the genes directly (red) and indirectly (orange) connected to PRDM1 through other enriched transcription factors. The network was visualized with Cytoscape software. EM T cell: Effector memory T cell; CM T cell: Central memory T cell; PRDM1: transcription factor PR/SET domain 1.
