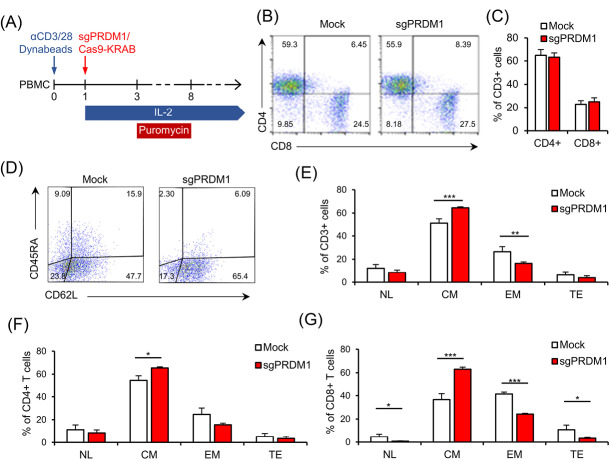
Fig. 4.
BLIMP1 knock-down prevents EM and TE T cell phenotypes and increases CM T cell differentiation. A) The schematic timeline of the experimental setting. PBMC was activated by anti-CD3/CD28 Dynabead on day zero. The sgPRDM1/Cas9-KRAB genetic constructs that contain the designed sgRNAs were transduced into T cells of different groups on the first day. T cells received IL-2 from the first day until the end of the experiment, while puromycin treatment was carried out for six days. Flow cytometry assessments were done at different days after the puromycin treatment. B) The scatter plot represents the percentages of the CD4+ and CD8+ T cell population on day 10 in a representative donor. This assessment was fulfilled after puromycin selection on the transduced groups. C) The bar graph represents the percentages of CD4+ and CD8+ T cell populations on day 10. There was no observed association between transcription factor PR/SET domain 1 (PRDM1) knock-down and the CD4+/CD8+ ratio. D) Scatter plot shows the percentages of CD62L and CD45RA expression in the whole T cell population on day 22 in the Mock group and in the whole T cell population on day 22 in the Mock and sgPRDM1 groups. A meaningful increase in BLIMP1-deficient CM T cells and a significant reduction in EM T cells is shown. F) Bar graph depicts the different T cell phenotypes in the CD4+ T cell population on day 22 in the Mock and sgPRDM1 groups. G) Bar graph depicts the different T cell phenotypes in the CD8+ T cell population on day 22 in the Mock and sgPRDM1 groups. The data are presented as mean ± SD, *P < 0.05, **P < 0.01 and ***P < 0.001, n = 3. EM T cell: Effector memory T cell; TE T cell: Terminally effector T cell; CM T cell: Central memory T cell; BLIMP1: B lymphocyte-induced maturation protein 1; PBMC: Peripheral blood mononuclear cells.

