Fig. 6.
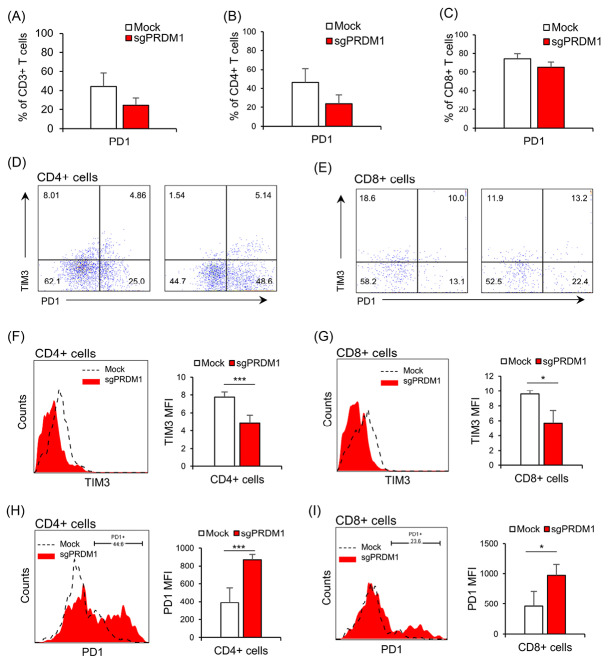
The impact of BLIMP1 knock-down on exhaustion markers PD1 and TIM3 in the Mock and sgPRDM1 groups in CD4+ and CD8+ T cells. On day 18, there were no statistically meaningful differences observed in the expression levels of PD1 and TIM3 between BLIMP1-sufficient and BLIMP1-deficient T cells. However, on day 25, there was a decline in TIM3 expression and an increase in PD1 expression in BLIMP1-deficient T cells rather than BLIMP1-sufficient T cells. Bar graphs show: A) expression of the exhaustion marker PD1 in the whole T cell population for the Mock and sgPRDM1 groups on day 18 and B, C) expression of the exhaustion marker PD1 in the CD4+ and CD8+ T cell populations, respectively, for the Mock and sgPRDM1 groups on day 18. D, E) Scatter plots depict the expression of the exhaustion markers PD1 and TIM3 in the CD4+ and CD8+ T cell populations, respectively, for the Mock and sgPRDM1 groups on day 25. F, G) The representative histogram and bar graph delineate TIM3 expression in the CD4+ and CD8+ T cell populations, respectively, on day 25. H, I) The representative histogram plot and bar graph show PD1 expression in the CD4+ and CD8+ T cell populations, respectively, on day 25. BLIMP1: B lymphocyte-induced maturation protein 1.

