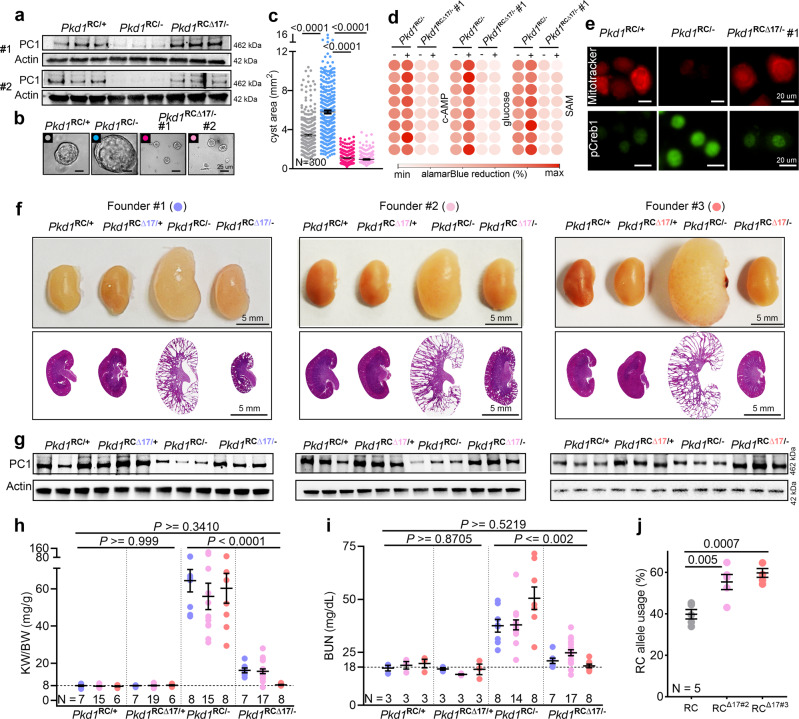
Fig. 2. Monoallelic Pkd1 derepression alleviates polycystic kidney disease.
a Immunoblot showing reduced PC1 expression in Pkd1RC/- compared to Pkd1RC/+ cells. PC1 level was restored in Pkd1RCΔ17/- cells. #1 and #2 refer to the two independent Pkd1RCΔ17/- clonal cell lines. Actin serves as the loading control. n = 3 biologically independent samples. b–c Representative images and quantification showing increased 3D cyst size of Pkd1RC/- compared to Pkd1RC/+ cells cultured in Matrigel. Cyst size was normalized in Pkd1RCΔ17/- cells. n = 300 cysts pooled from three independent experiments. d Heatmap showing alamarBlue-assessed proliferation of Pkd1RC/- and Pkd1RCΔ17/- cells in the absence (−) or presence (+) of 100 uM cAMP, 17 mM glucose, or 100 uM SAM. n = 8, each circle represents a biological replicate. e Representative images showing Mito-tracker labeling and anti-pCreb1 immunostaining in Pkd1RC/+, Pkd1RC/-, and Pkd1RCΔ17/- cells. n = 3 biologically dependent experiments. f Gross kidney and H&E-stained kidney sections from 18-day-old mice with the indicated genotypes. Data from the progeny of the three founders are shown separately. Founder #1: Pkd1RC/+ (n = 7), Pkd1RC∆17/+ (n = 7), Pkd1RC/- (n = 8), and Pkd1RC∆17/- (n = 7). Founder #2: Pkd1RC/+ (n = 15), Pkd1RC∆17/+ (n = 19), Pkd1RC/- (n = 15), and Pkd1RC∆17/- (n = 17). Founder #3: Pkd1RC/+ (n = 6), Pkd1RC∆17/+ (n = 6), Pkd1RC/- (n = 8), and Pkd1RC∆17/- (n = 8). g Immunoblot showing PC1 expression in kidneys of 18-day-old mice with the indicated genotypes derived from the three founders. Actin serves as the loading control. n = 3 independent kidney samples for each genotype and founder. h, i KW/BW ratio and BUN levels in mice with the indicated genotypes are shown. Data from all three founders are shown. Founder#1 (blue circles), Founder#2 (light pink circles), and Founder#3 (orange circles). (j) Paired-end RNA-seq data showing the RC allele usage in Pkd1RC/- (grey circles, n = 5), Pkd1RCΔ17/- founder#2 (pink circles, n = 5), and Pkd1RCΔ17/- founder#3 (orange circles, n = 5). Error bars indicate SEM. Statistical analysis: One-way ANOVA, Tukey’s multiple-comparisons test (c, h–j). Source data are provided as a Source Data file.

