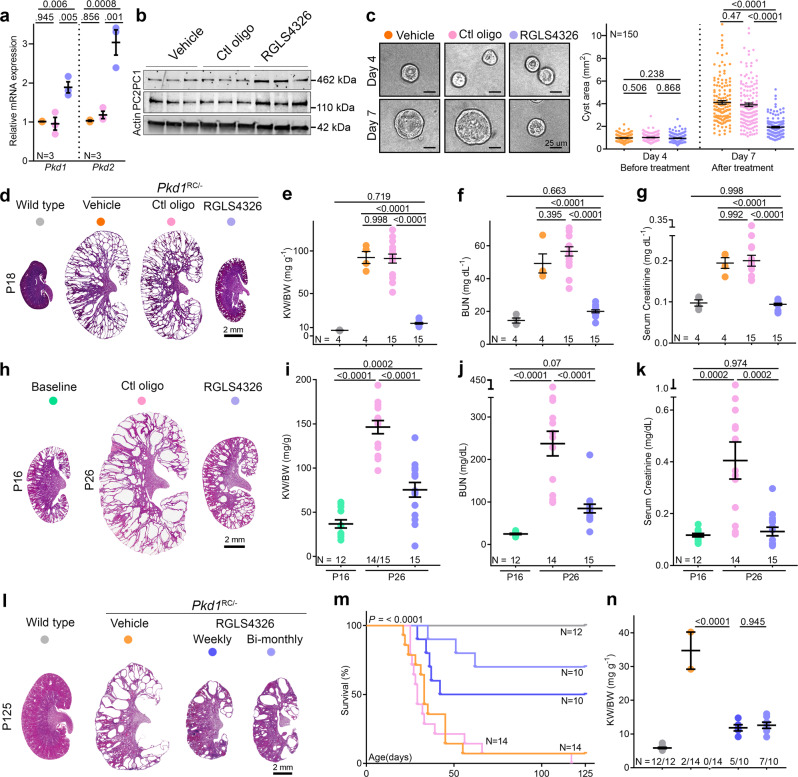
Fig. 5. Acute Pkd1 and Pkd2 derepression attenuate PKD.
a–b qRT-PCR and immunoblot analysis showing Pkd1/PC1 and Pkd2/PC2 expression in Pkd1RC/- cells transfected with vehicle (PBS), 100 uM control oligonucleotide, or 100 uM RGLS4326. c Images and quantification of 3D cyst size of Pkd1RC/- cells cultured in Matrigel before (day 4) or after (day 7) transfection with vehicle (PBS), 100 uM control oligonucleotide, or 100 uM RGLS4326. d H&E-stained kidney sections from 18-day-old Pkd1RC/- mice injected on P10, P11, P12, and P16 either with vehicle (PBS), 20 mg/kg control oligonucleotide, or 20 mg/kg RGLS4326. H&E-stained kidney section from untreated 18-day-old wildtype mouse is shown for reference. e–g KW/BW, BUN, and serum creatinine levels in 18-day-old Pkd1RC/- mice treated with vehicle (PBS), 20 mg/kg control oligonucleotide, or 20 mg/kg RGLS4326 are shown. Data from untreated 18-day-old wildtype mice are shown as a reference. h H&E-stained kidney sections from 26-day-old Pkd1RC/- mice injected on P16 and P17 with 20 mg/kg control oligonucleotide or 20 mg/kg RGLS4326. H&E-stained kidney sections from genetically matched but untreated 16-day-old Pkd1RC/- mice are shown to depict disease prior to starting treatment. i–k KW/BW, BUN, and serum creatinine levels in untreated 16-day-old or treated 26-day-old Pkd1RC/- mice are shown. l–n Pkd1RC/- mice were injected on P16 and P17 with vehicle, 20 mg/kg RGLS4326, or 20 mg/kg control oligonucleotide. These mice then received their respective treatment regimen every week until 18 weeks of age. The fourth cohort of Pkd1RC/- mice received 20 mg/kg RGLS4326 treatment on P16, P17, and bimonthly thereafter. l H&E-stained kidney sections of 125-day-old Pkd1RC/- mice on the vehicle or RGLS4326 treatment are shown. m Kaplan-Meir survival curves of Pkd1RC/- mice in the four treatment groups. Survival of untreated wildtype is shown as a reference. n KW/BW ratio in mice that survived till 125 days. Wildtype mice: n = 3; Pkd1RC/- mice: n = 2 (vehicle treatment), n = 5 (weekly RGLS4326 treatment), and n = 7 (bi-monthly RGLS4326 treatment). Error bars indicate SEM. Statistical analysis: One-way ANOVA, Tukey’s multiple-comparisons test (a, c, e–g, i–k, n); Mantel-Cox (m). Source data are provided as a Source Data file.

