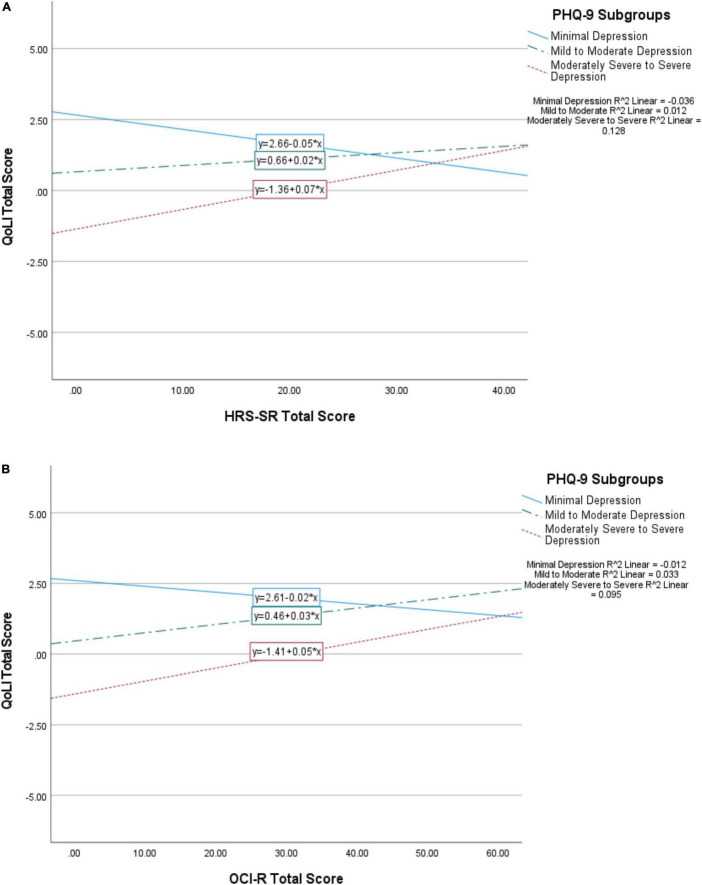
FIGURE 1.
Interaction of PHQ-9 subgroups (minimal depression, mild to moderate depression, moderately severe to severe depression) with HRS-SR (A) and OCI-R (B) scores upon total QoL. Minimal depression is represented by a solid line, mild to moderate by a dotted and dashed line, and moderately severe to severe by a dashed line. The symbol * represents multiplication.

