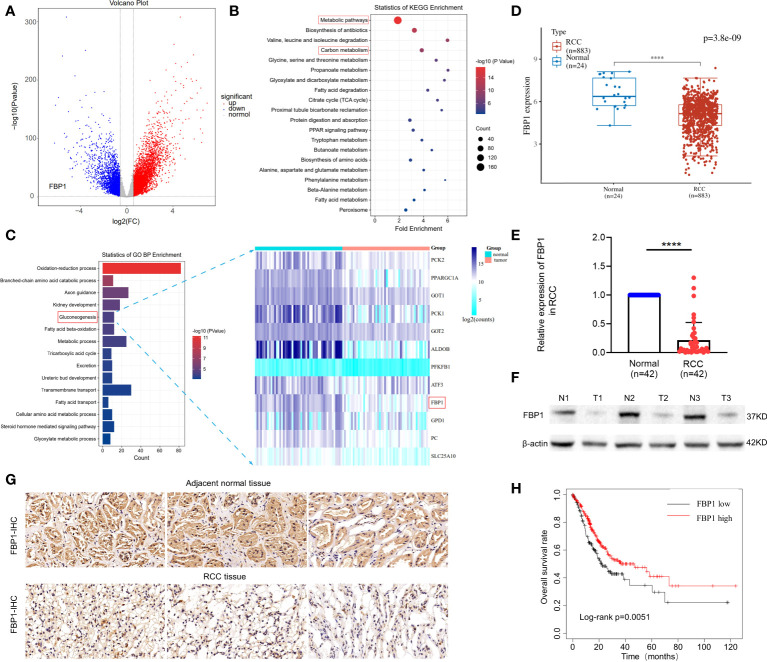
Figure 1.
FBP1 is reduced in RCC and related to poor survival outcome. (A) Volcano Plot of differentially expressed mRNAs associated with glucose metabolism of Warburg effect in RCC and adjacent normal tissues. Blue represents downregulated genes, and red represents upregulated genes. p < 0.05. (B, C) KEGG pathway and gene oncology (GO) profiling for the downregulated genes in RCC. (D) The mRNA expression levels of FBP1 in RCC and adjacent normal renal tissues from TCGA database by bioinformatic analysis. (E) The mRNA expression levels of FBP1 in RCC and adjacent normal renal tissues detected by qPCR. (F) The protein level of FBP1 in 3 randomly selected paired RCC and adjacent normal renal tissues by western blot. b-actin was used as input control. (G) Representative pictures of immunohistochemical (IHC) staining of 3 randomly selected paired RCC tissue and adjacent normal renal tissues. (H) Kaplan–Meier plots of overall survival in RCC patients with low expression of FBP1 (n=166) compared to high expression of FBP1 (n=178) stratified by the expression levels of FBP1. The cutoff was confirmed as the threshold with the best performance. Log-rank test p value is shown. Results are shown as mean ± S.D., ****p < 0.0001.

