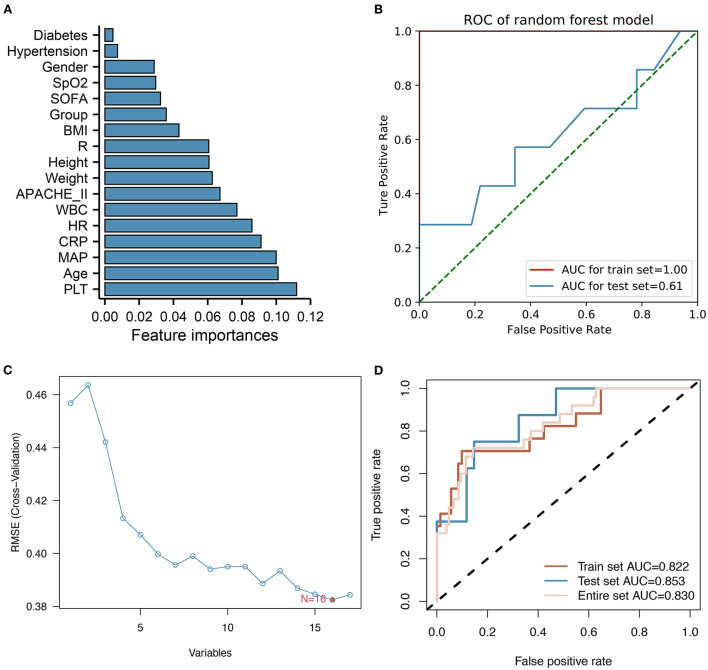
Figure 1.
Feature ranking and filtering process for Random Forest and SVM-RFE models. (A) Bar chart showing a random forest model's importance ranking of each variable. PLT, age, MAP, CRP, and HR are the top five variables identified. (B) ROC curves showing the classification ability of the random forest model. (C) The feature screening process of SVM-RFE results in the model with the lowest RMSE when 16 variables are selected. (D) ROC curves showing training, test, and overall classification performances of the SVM model.

