Figure 4.
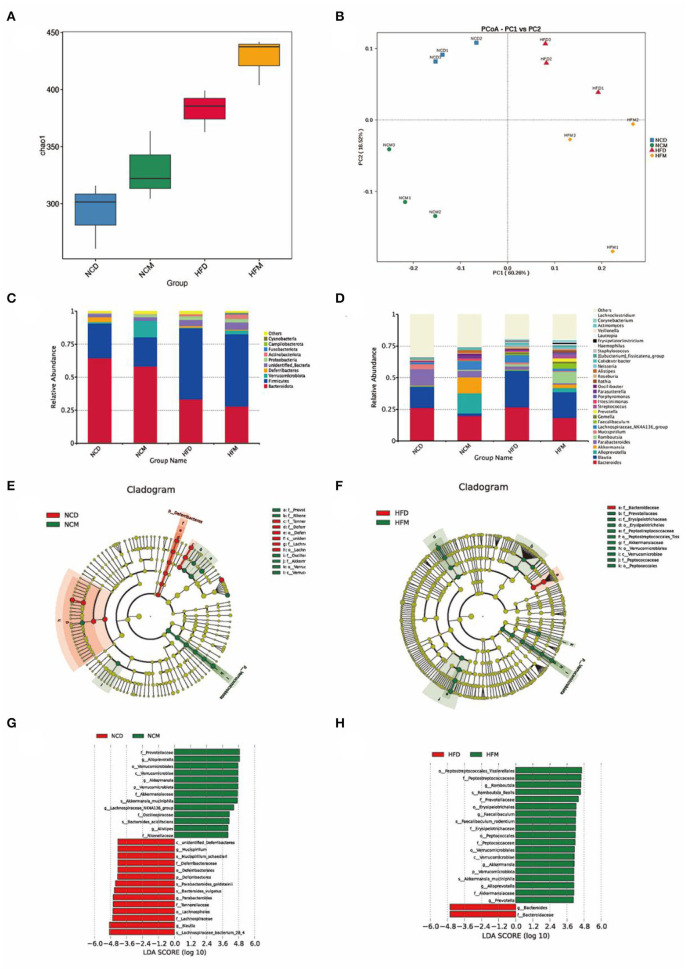
Effects of matcha supplementation on gut microbiota. (A) Alpha diversity of the gut microbiome community of four groups. The diversity was assessed within the QIIME2 pipeline based on the Chao1 index. (B) Principal coordinates analysis (PCoA) of the gut microbiome community structure. The community clustering is based on Bray–Curtis dissimilarities (Weighted UniFrac). (C) Relative abundance of gut microbiota at the phylum level. (D) Relative abundance of intestinal microbiota at the genus level. LEfSe analysis of intestinal microbiota composition based on relative abundances of 16S rRNA. LEfSe cladogram (E,F) representing different abundant taxa and LDA scores (G,H) as calculated by LEfSe analysis. Only taxa with LDA scores of more than 3 were presented. NCD, mice on a normal chow diet; HFD, mice on a high-fat diet; NCM, mice on a normal chow diet with 1.0% matcha; HFM, mice on a high-fat diet with 1.0% matcha.

