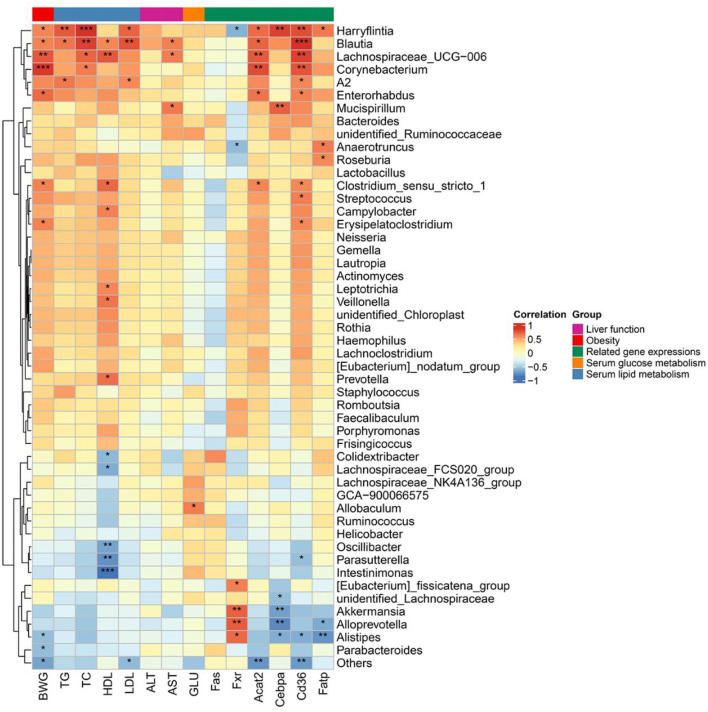
Figure 6.
Spearman's correlation analysis of the top 50 abundance intestinal microbiota at the genus level with obesity traits and metabolic parameters. The degree of red indicates that the relationship between them tends to be positively correlated. In contrast, the blue degree indicates that the relationship between them tends to be negatively correlated. Asterisk denotes p < 0.05, double asterisk denotes p < 0.01, triple asterisk denotes p < 0.005.

