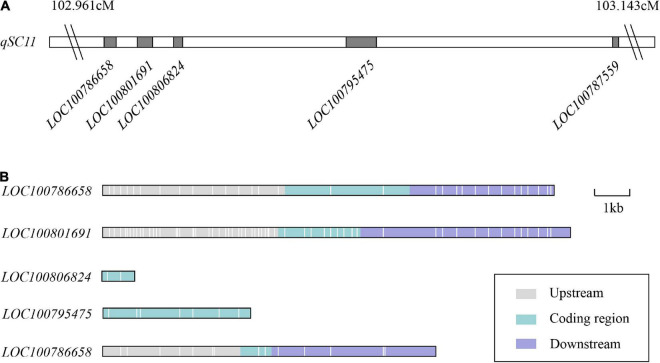
FIGURE 5.
Distribution of the five candidate genes for seed coat color on qSC11. (A) Distribution of the candidate genes on qSC11. (B) Variation distribution of the candidate genes on qSC11. The upstream and downstream represent the 5 kb within the region of transcription start and stop sites, respectively. The regions are markers of different colors. Each white line represents one SNP/InDel variant.

