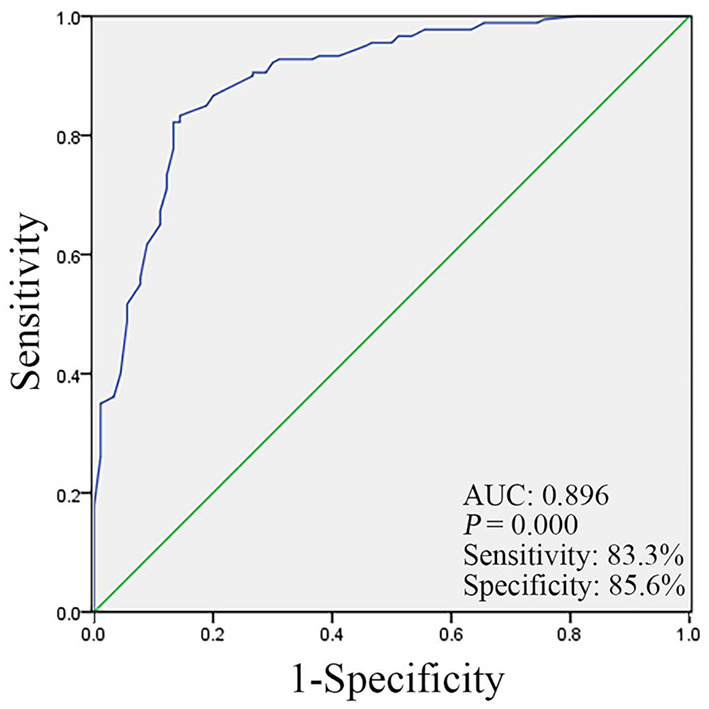
Figure 2.

The receiver operating characteristic (ROC) curve analysis for the education level, underlying diseases, living environment, and body mass index (BMI) value in the NTM group and control group.

The receiver operating characteristic (ROC) curve analysis for the education level, underlying diseases, living environment, and body mass index (BMI) value in the NTM group and control group.