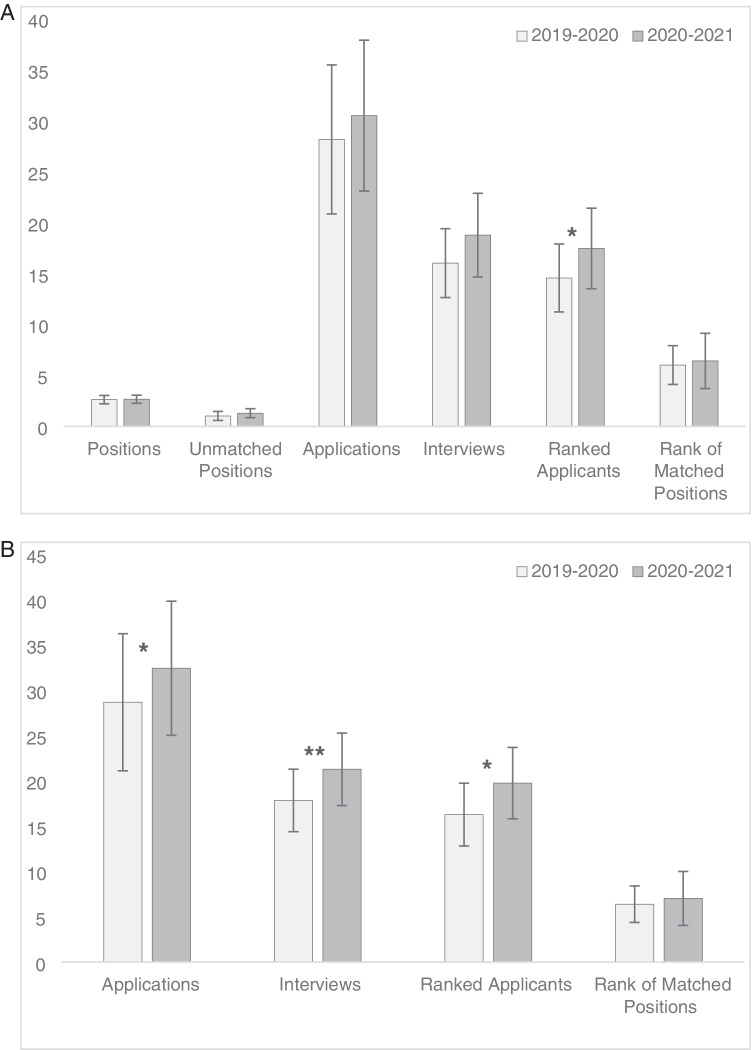
Fig. 1.
A The bar chart shows a visual representation of the primary analysis of the survey results between the two match cycles. Significance is denoted by * for p < 0.05, with whiskers representing the 95% confidence interval. B The bar graph shows a visual representation of the secondary analysis of the survey results between the two match cycles. Significance is denoted by * for p < 0.05 and ** for p < 0.01, with whiskers representing the 95% confidence interval

