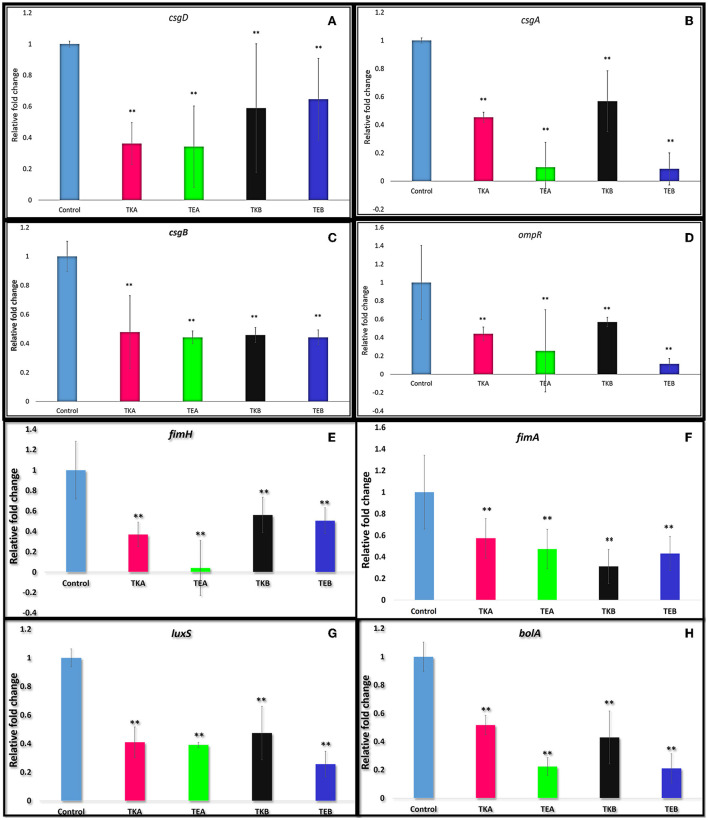
Figure 1.
(A) csgD gene downregulation quantified by quantitative real-time PCR in E. coli Nissle 1917 (EcN) and K12 strain. The csgD-KD mutant A showed a 65.8% suppression in EcN (TEA) and in K12 cells and 63.8% reduction (TKA) as compared to the control cells (cells having no aTc induction but have both plasmids). The csgD-KD mutant B showed a 35.4% reduction in EcN (TEB) and 41.0% reduction in K12 (TKB). (B–H) Downregulation of the different genes in csgD-KD cells of EcN (TEA and TEB) and K12 (TKA and TKB). (B) Downregulation of csgA gene. (C) Downregulation of csgB gene. (D) Downregulation of ompR gene. (E) Downregulation of fimH gene. (F) Downregulation of fimA gene. (G) Downregulation of luxS gene. (H) Downregulation of bolA gene. The gene expression data was represented in fold change. One-way ANOVA analysis was done, and the *p-value < 0.05,**p-value < 0.005 was considered statistically significant. The 16s rRNA gene was used as endogenous control.

