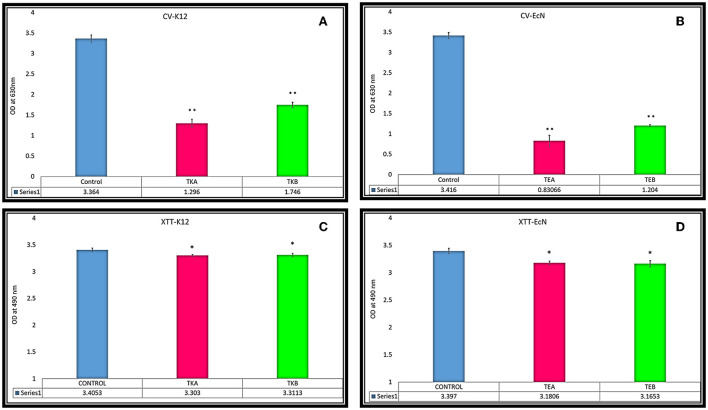
Figure 2.
(A,B) Biofilm reduction quantification was done through CV assay in csgD-KD cells. (A) TKA showed 61.47% and TKB 48.09% biofilm reduction, respectively, compared to the control cells. (B) The EcN csgD-KD mutants TEA and TEB showed 75.6% and 64.7% biofilm reduction. (C,D) XTT reduction assay for cell viability in csgD csgD-KD cells. (C) Cell viability of csgD-KD cells of K12 (TKA and TKB) (D) Cell viability of csgD-KD cells of EcN (TEA and TEB). The data shown here represent an average value of triplicate experiments ± S (*P < 0.05, t-test, two-sided), (**P < 0.005, t-test, two-sided).

