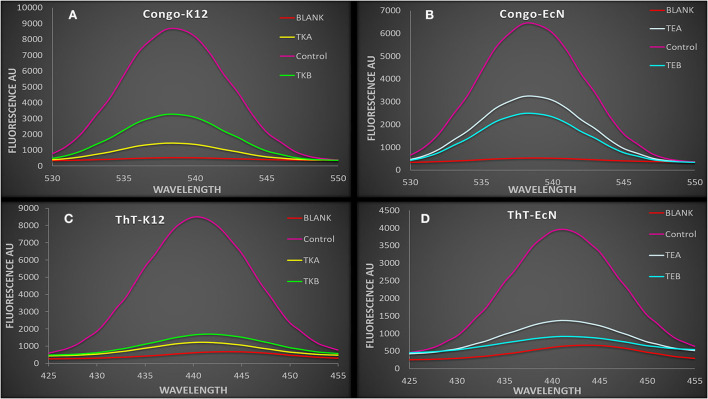
Figure 3.
(A,B) The spectra showing Congo red fluorescence assay of csgD-KD cells. The control cell showed a higher fluorescence intensity as compared to the csgD-KD cells (A) Congo red fluorescence assay of csgD-KD cells of K12 (TKA and TKB) (B) Congo red fluorescence assay of csgD-KD cells of EcN (TEA and TEB). (C,D) The spectra are showing ThT (thioflavin) fluorescence assay in csgD-KD cells. The decline in fluorescence spectra intensity suggests lower curli amyloid production in csgD-KD cells, (C) ThT fluorescence assay of TKA and TKB, (D) ThT fluorescence assay of TEA and TEB.

