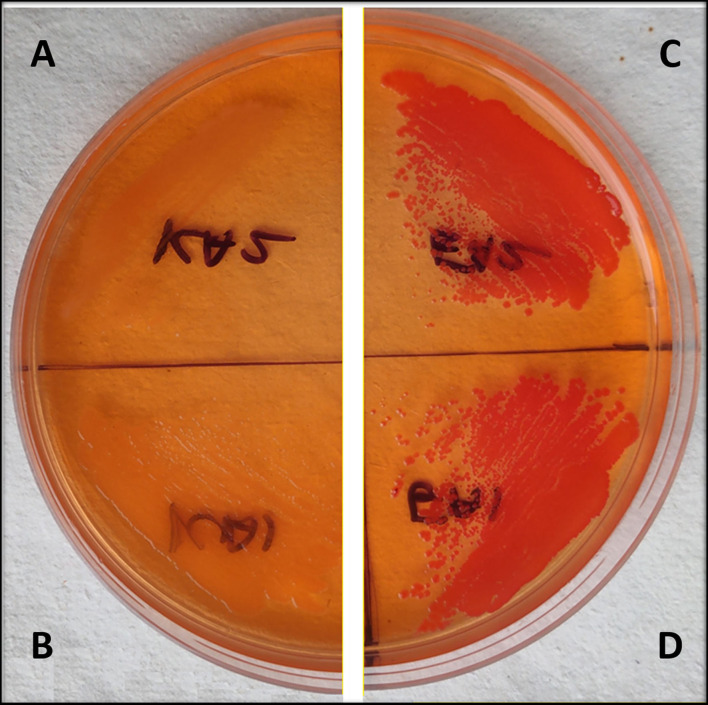
Figure 4.
(A–D) Congo red agar plate assay of EcN and K12 cells with csgD knockdown. (A,B) show csgD-KD cells of EcN and K12, respectively, while (C,D) show control cells of EcN and K12. The Congo red agar plates show a yellowish-white colony in mutated cells, suggesting a decrease in the curli production.

